Images and Plots
Events can contain any block content — including images and code chunk output such as R plots.
Inline images
Place a standard Markdown image inside an .event div:
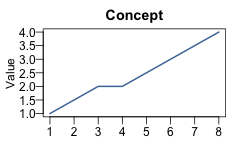
Concept sketch
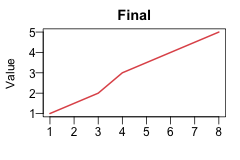
Final design
::: {.timeline .vertical}
::: {.event data-label="2020"}
**Concept sketch**

:::
::: {.event data-label="2022"}
**Final design**

:::
:::Images are constrained to the event width via max-width: 100%, so they scale down automatically in narrow events such as those in the horizontal layout.
R plots
Place a code chunk inside an .event div. Use fig-width and fig-height to control the rendered size. In the horizontal layout each event is narrow, so keep plots compact:
```{r}
#| fig-width: 2.5
#| fig-height: 3
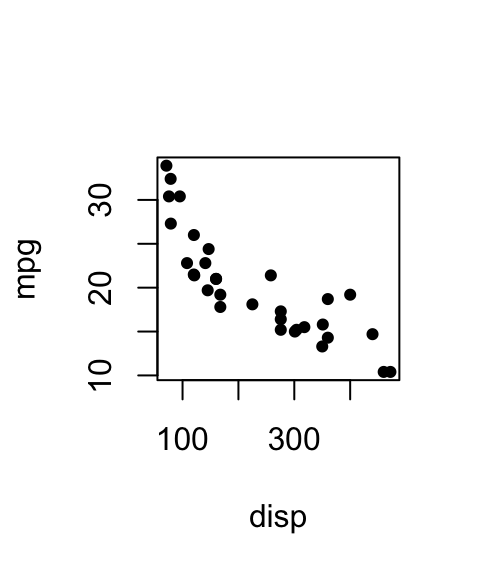
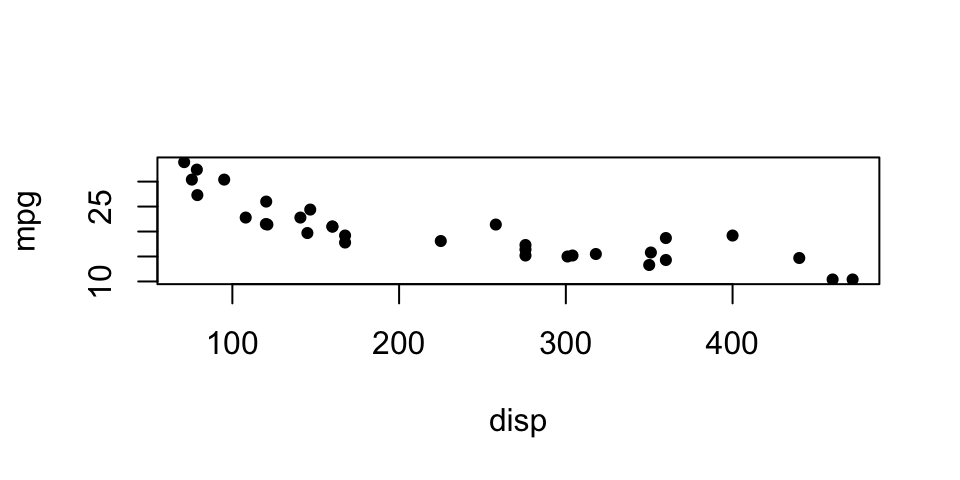
plot(mpg ~ disp, data = mtcars, pch = 19, cex = 0.7)
```Horizontal
MPG vs displacement
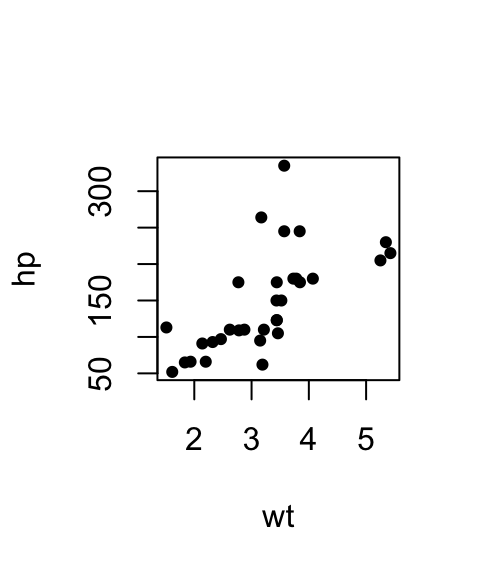
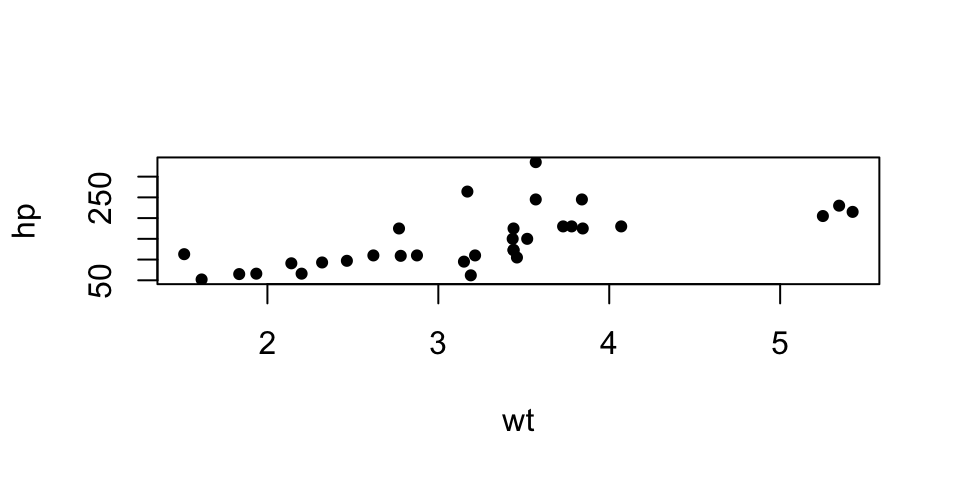
HP vs weight
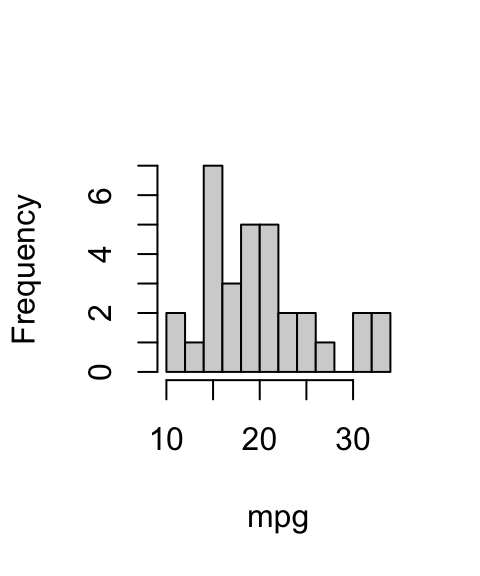
MPG distribution
::: timeline
::: {.event data-label="Displacement"}
**MPG vs displacement**

```{r}
#| fig-width: 2.5
#| fig-height: 3
plot(mpg ~ disp, data = mtcars, pch = 19, cex = 0.7)
```
:::
...
:::
Vertical
Vertical events span the full content width, so larger plots fit well:
Displacement vs MPG
Weight vs HP
::: {.timeline .vertical}
::: {.event data-label="Step 1"}
**Displacement vs MPG**

```{r}
#| fig-width: 5
#| fig-height: 2.5
plot(mpg ~ disp, data = mtcars, pch = 19, cex = 0.7)
```
:::
...
:::
RevealJS sizing
In RevealJS presentations, events in the horizontal layout are wider than in HTML documents (a 1280 × 720 slide with three events gives each event ~413 px). Scale up accordingly:
```{r}
#| fig-width: 5
#| fig-height: 3
plot(mpg ~ disp, data = mtcars, pch = 19, cex = 0.7)
```
For vertical layouts on a RevealJS slide, events span the full slide width, so even wider plots work well:
```{r}
#| fig-width: 8
#| fig-height: 3
plot(mpg ~ disp, data = mtcars, pch = 19, cex = 0.7)
```