Group a data.frame by percentile ranges in variable with constant upper bound
percentify_min.RdThis function is a small wrapper around percentify, where the
upper bound is a fixed value.
percentify_min(data, var, q = numeric(), lower = 0)
Arguments
| data | A data.frame or tibble, |
|---|---|
| var | Variable to do grouping by as string or symbol. |
| q | Numerical values for upper bound of ranges. Must be between 0 and 1. |
| lower | Numerical values for lower bound of ranges. Must be between 0 and 1. Length of lower and upper must be equal. |
Value
percentile grouped tibble
Details
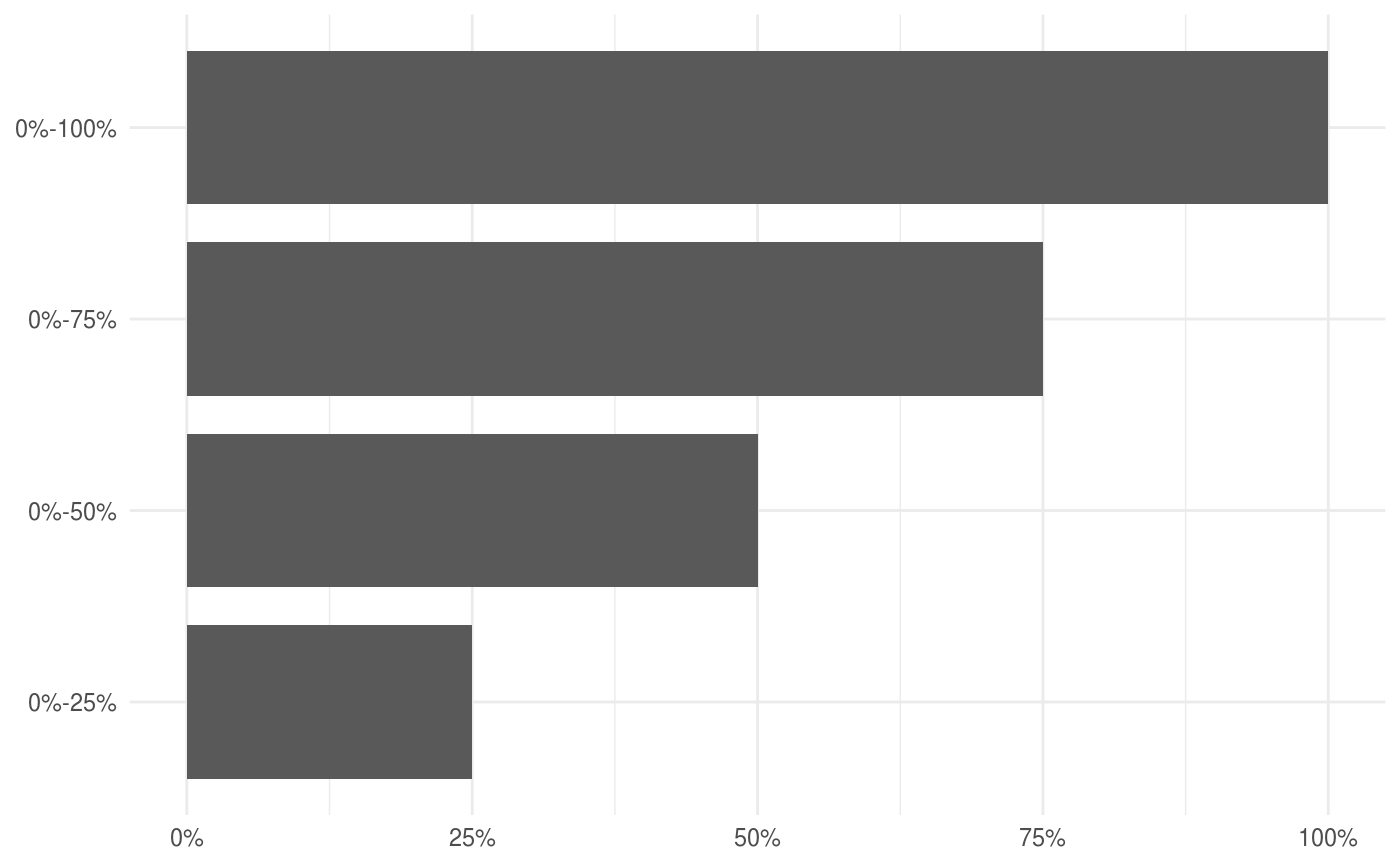
There is a ggplot2::autoplot() to visualize the the percentile ranges.
See also
Other percentile samplers: autoplot.percentiled_df,
percentify_cut,
percentify_max,
percentify_random
Examples
library(dplyr) library(broom) percent_mtcars <- percentify_min(mtcars, mpg, c(0.25, 0.5, 0.75, 1)) percent_mtcars#> # A tibble: 32 x 11 #> # Groups: .percentile_mpg [4] #> mpg cyl disp hp drat wt qsec vs am gear carb #> <dbl> <dbl> <dbl> <dbl> <dbl> <dbl> <dbl> <dbl> <dbl> <dbl> <dbl> #> 1 21 6 160 110 3.9 2.62 16.5 0 1 4 4 #> 2 21 6 160 110 3.9 2.88 17.0 0 1 4 4 #> 3 22.8 4 108 93 3.85 2.32 18.6 1 1 4 1 #> 4 21.4 6 258 110 3.08 3.22 19.4 1 0 3 1 #> 5 18.7 8 360 175 3.15 3.44 17.0 0 0 3 2 #> 6 18.1 6 225 105 2.76 3.46 20.2 1 0 3 1 #> 7 14.3 8 360 245 3.21 3.57 15.8 0 0 3 4 #> 8 24.4 4 147. 62 3.69 3.19 20 1 0 4 2 #> 9 22.8 4 141. 95 3.92 3.15 22.9 1 0 4 2 #> 10 19.2 6 168. 123 3.92 3.44 18.3 1 0 4 4 #> # … with 22 more rows#> # A tibble: 4 x 4 #> .percentile_mpg mean_hp mean_wt n_obs #> <chr> <dbl> <dbl> <int> #> 1 0%-25% 226. 4.28 8 #> 2 0%-50% 193. 3.90 17 #> 3 0%-75% 167. 3.54 25 #> 4 0%-100% 147. 3.22 32#> # A tibble: 11 x 6 #> # Groups: .percentile_mpg [4] #> .percentile_mpg term estimate std.error statistic p.value #> <chr> <chr> <dbl> <dbl> <dbl> <dbl> #> 1 0%-25% (Intercept) 28.0 60.1 0.466 0.658 #> 2 0%-25% wt 80.0 13.8 5.80 0.00115 #> 3 0%-50% (Intercept) -433. 113. -3.85 0.00178 #> 4 0%-50% wt 67.5 16.3 4.15 0.000977 #> 5 0%-50% cyl 64.5 14.9 4.34 0.000674 #> 6 0%-75% (Intercept) -240. 43.6 -5.50 0.0000158 #> 7 0%-75% wt 69.3 14.5 4.77 0.0000924 #> 8 0%-75% cyl 38.7 7.73 5.01 0.0000516 #> 9 0%-100% (Intercept) -190. 27.2 -7.00 0.000000107 #> 10 0%-100% wt 59.5 12.0 4.96 0.0000281 #> 11 0%-100% cyl 37.1 6.57 5.65 0.00000423
