Group a data.frame by percentile ranges in variable
percentify.Rdpercentify() is the main function in percentify. It takes a data.frame or
tibble, and creates groups based on the quantiles lower and upper bounds
specified. This become handy once you start working with multiple
overlapping bounds.
autoplot.percentiled_df(object)

percentify(data, var, lower = 0, upper = 1, key = ".percentile")
Arguments
| object | The |
|---|---|
| data | A data.frame or tibble, |
| var | Variable to do grouping by as string or symbol. |
| lower | Numerical values for lower bound of ranges. Must be between 0 and 1. Length of lower and upper must be equal. |
| upper | Numerical values for upper bound of ranges. Must be between 0 and 1. Length of lower and upper must be equal. |
| key | A single character specifying the name of the virtual group that is added. Defaults to ".percentile". |
Value
percentile grouped tibble
Details
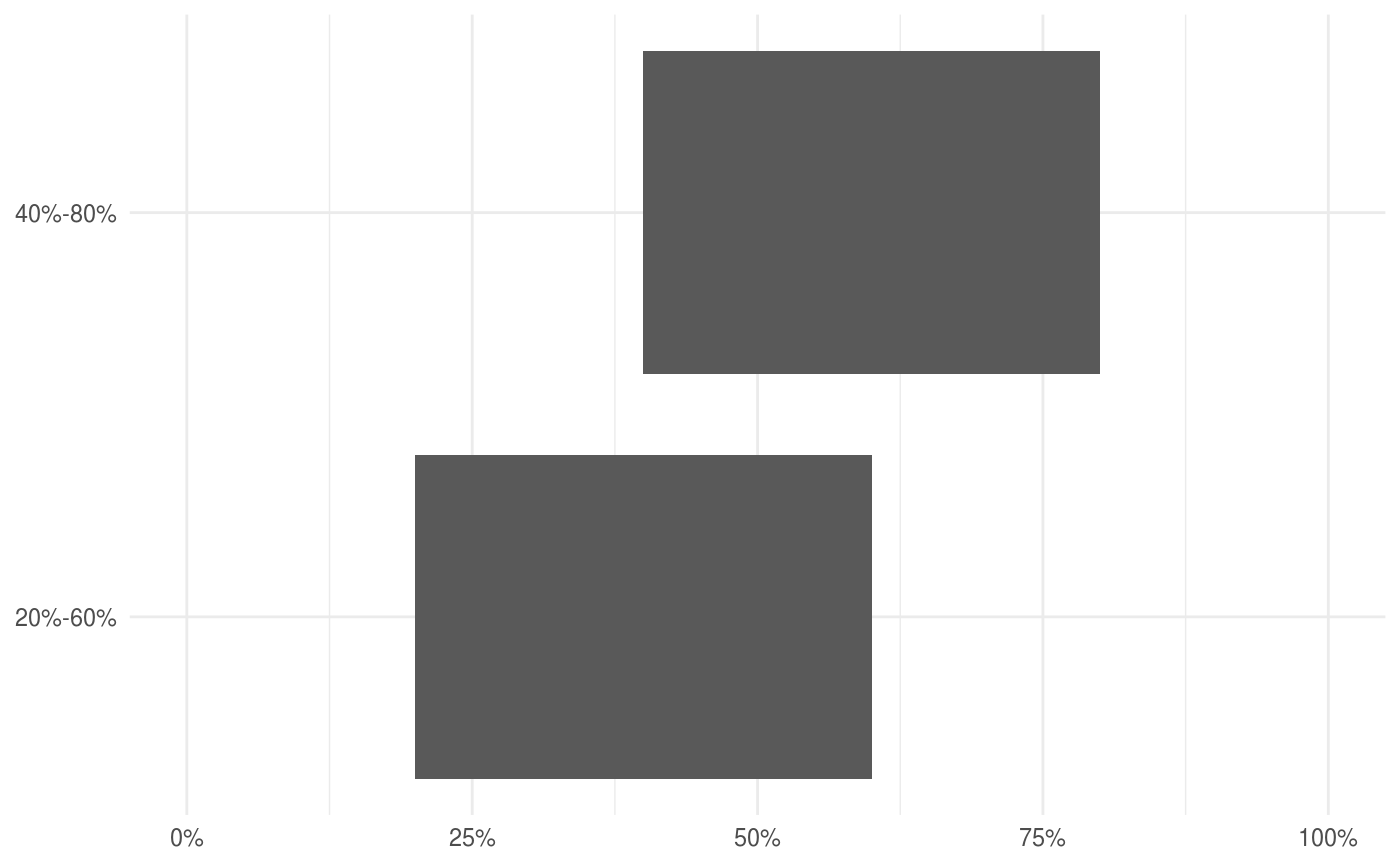
There is a ggplot2::autoplot() to visualize the the percentile ranges.
See also
Other percentile samplers: percentify_cut,
percentify_max,
percentify_min,
percentify_random
Examples
library(dplyr) library(broom) percent_mtcars <- percentify(mtcars, mpg, lower = c(0.2, 0.4), upper = c(0.6, 0.8) ) percent_mtcars#> # A tibble: 32 x 11 #> # Groups: .percentile_mpg [2] #> mpg cyl disp hp drat wt qsec vs am gear carb #> <dbl> <dbl> <dbl> <dbl> <dbl> <dbl> <dbl> <dbl> <dbl> <dbl> <dbl> #> 1 21 6 160 110 3.9 2.62 16.5 0 1 4 4 #> 2 21 6 160 110 3.9 2.88 17.0 0 1 4 4 #> 3 22.8 4 108 93 3.85 2.32 18.6 1 1 4 1 #> 4 21.4 6 258 110 3.08 3.22 19.4 1 0 3 1 #> 5 18.7 8 360 175 3.15 3.44 17.0 0 0 3 2 #> 6 18.1 6 225 105 2.76 3.46 20.2 1 0 3 1 #> 7 14.3 8 360 245 3.21 3.57 15.8 0 0 3 4 #> 8 24.4 4 147. 62 3.69 3.19 20 1 0 4 2 #> 9 22.8 4 141. 95 3.92 3.15 22.9 1 0 4 2 #> 10 19.2 6 168. 123 3.92 3.44 18.3 1 0 4 4 #> # … with 22 more rows#> # A tibble: 2 x 4 #> .percentile_mpg mean_hp mean_wt n_obs #> <chr> <dbl> <dbl> <int> #> 1 20%-60% 157. 3.40 14 #> 2 40%-80% 123. 3.03 12#> # A tibble: 6 x 6 #> # Groups: .percentile_mpg [2] #> .percentile_mpg term estimate std.error statistic p.value #> <chr> <chr> <dbl> <dbl> <dbl> <dbl> #> 1 20%-60% (Intercept) -279. 97.9 -2.85 0.0159 #> 2 20%-60% wt 1.25 36.1 0.0346 0.973 #> 3 20%-60% cyl 74.3 14.7 5.07 0.000361 #> 4 40%-80% (Intercept) -266. 86.8 -3.06 0.0135 #> 5 40%-80% wt 76.3 40.1 1.90 0.0898 #> 6 40%-80% cyl 40.9 13.0 3.15 0.0118
