Using resampling to estimate performance
useR2022
Emil Hvitfelt
Resampling methods
These are additional data splitting schemes that are applied to the training set and are used for estimating model performance.
They attempt to simulate slightly different versions of the training set. These versions of the original are split into two model subsets:
- The analysis set is used to fit the model (analogous to the training set).
- Performance is determined using the assessment set.
This process is repeated many times.
The model workflow and resampling
All resampling methods repeat this process multiple times:
The final resampling estimate is the average of all of the estimated metrics (e.g. RMSE, etc).
![]()
V-Fold cross-validation
Here, we randomly split the training data into V distinct blocks of roughly equal size (AKA the “folds”).
- We leave out the first block of analysis data and fit a model.
- This model is used to predict the held-out block of assessment data.
- We continue this process until we’ve predicted all V assessment blocks
The final performance is based on the hold-out predictions by averaging the statistics from the V blocks.
V is usually taken to be 5 or 10 and leave-one-out cross-validation has each sample as a block.
Repeated CV can be used when training set sizes are small. 5 repeats of 10-fold CV averages for 50 sets of metrics.
3-Fold cross-validation with n = 30
Randomly assign each sample to one of three folds
![]()
3-Fold cross-validation with n = 30
![]()
Resampling results
The goal of resampling is to produce a single estimate of performance for a model.
Even though we end up estimating V models (for V-fold CV), these models are discarded after we have our performance estimate.
Resampling is basically an empirical simulation system_ used to understand how well the model would work on new data.
Cross-validating using rsample
rsample has a number of resampling functions built in. One is vfold_cv(), for performing V-Fold cross-validation like we’ve been discussing.
set.seed(2453)

elevators_folds <- vfold_cv(elevators_train) #10-fold is default

elevators_folds
#> #  10-fold cross-validation
#> # A tibble: 10 × 2
#>    splits               id
#>    <list>               <chr>
#>  1 <split [23652/2629]> Fold01
#>  2 <split [23653/2628]> Fold02
#>  3 <split [23653/2628]> Fold03
#>  4 <split [23653/2628]> Fold04
#>  5 <split [23653/2628]> Fold05
#>  6 <split [23653/2628]> Fold06
#>  7 <split [23653/2628]> Fold07
#>  8 <split [23653/2628]> Fold08
#>  9 <split [23653/2628]> Fold09
#> 10 <split [23653/2628]> Fold10
Cross-validating Using rsample
- Each individual split object is similar to the
initial_split() example.
- Use
analysis() to extract the resample’s data used for the fitting process.
- Use
assessment() to extract the resample’s data used for the performance process.
elevators_folds$splits[[1]]
#> <Analysis/Assess/Total>
#> <23652/2629/26281>
elevators_folds$splits[[1]] %>%
  analysis() %>%
  dim()
#> [1] 23652    18
elevators_folds$splits[[1]] %>%
  assessment() %>%
  dim()
#> [1] 2629   18
Our resampling object
elevators_folds
#> #  10-fold cross-validation
#> # A tibble: 10 × 2
#>    splits               id
#>    <list>               <chr>
#>  1 <split [23652/2629]> Fold01
#>  2 <split [23653/2628]> Fold02
#>  3 <split [23653/2628]> Fold03
#>  4 <split [23653/2628]> Fold04
#>  5 <split [23653/2628]> Fold05
#>  6 <split [23653/2628]> Fold06
#>  7 <split [23653/2628]> Fold07
#>  8 <split [23653/2628]> Fold08
#>  9 <split [23653/2628]> Fold09
#> 10 <split [23653/2628]> Fold10
We will fit 10 models on 10 slightly different analysis sets.
Each will produce a separate RMSE and we will average the 10 RMSE values to get the resampling estimate of that statistic.
Generating the resampling statistics
Let’s use the workflow from the last section (elevators_wflow).
In tidymodels, there is a function called fit_resamples() that will do all of this for us:
ctrl <- control_resamples(save_pred = TRUE)

elevators_res <-fit_resamples(
  object = elevators_wflow,
  resamples = elevators_folds,
  control = ctrl
)
elevators_res
#> # Resampling results
#> # 10-fold cross-validation
#> # A tibble: 10 × 5
#>    splits               id     .metrics         .notes           .predictions
#>    <list>               <chr>  <list>           <list>           <list>
#>  1 <split [23652/2629]> Fold01 <tibble [2 × 4]> <tibble [0 × 3]> <tibble>
#>  2 <split [23653/2628]> Fold02 <tibble [2 × 4]> <tibble [0 × 3]> <tibble>
#>  3 <split [23653/2628]> Fold03 <tibble [2 × 4]> <tibble [0 × 3]> <tibble>
#>  4 <split [23653/2628]> Fold04 <tibble [2 × 4]> <tibble [0 × 3]> <tibble>
#>  5 <split [23653/2628]> Fold05 <tibble [2 × 4]> <tibble [0 × 3]> <tibble>
#>  6 <split [23653/2628]> Fold06 <tibble [2 × 4]> <tibble [0 × 3]> <tibble>
#>  7 <split [23653/2628]> Fold07 <tibble [2 × 4]> <tibble [0 × 3]> <tibble>
#>  8 <split [23653/2628]> Fold08 <tibble [2 × 4]> <tibble [0 × 3]> <tibble>
#>  9 <split [23653/2628]> Fold09 <tibble [2 × 4]> <tibble [0 × 3]> <tibble>
#> 10 <split [23653/2628]> Fold10 <tibble [2 × 4]> <tibble [0 × 3]> <tibble>
Getting the results
To obtain the resampling estimates of performance:
collect_metrics(elevators_res)
#> # A tibble: 2 × 6
#>   .metric .estimator  mean     n std_err .config
#>   <chr>   <chr>      <dbl> <int>   <dbl> <chr>
#> 1 rmse    standard   0.378    10 0.00411 Preprocessor1_Model1
#> 2 rsq     standard   0.770    10 0.00491 Preprocessor1_Model1
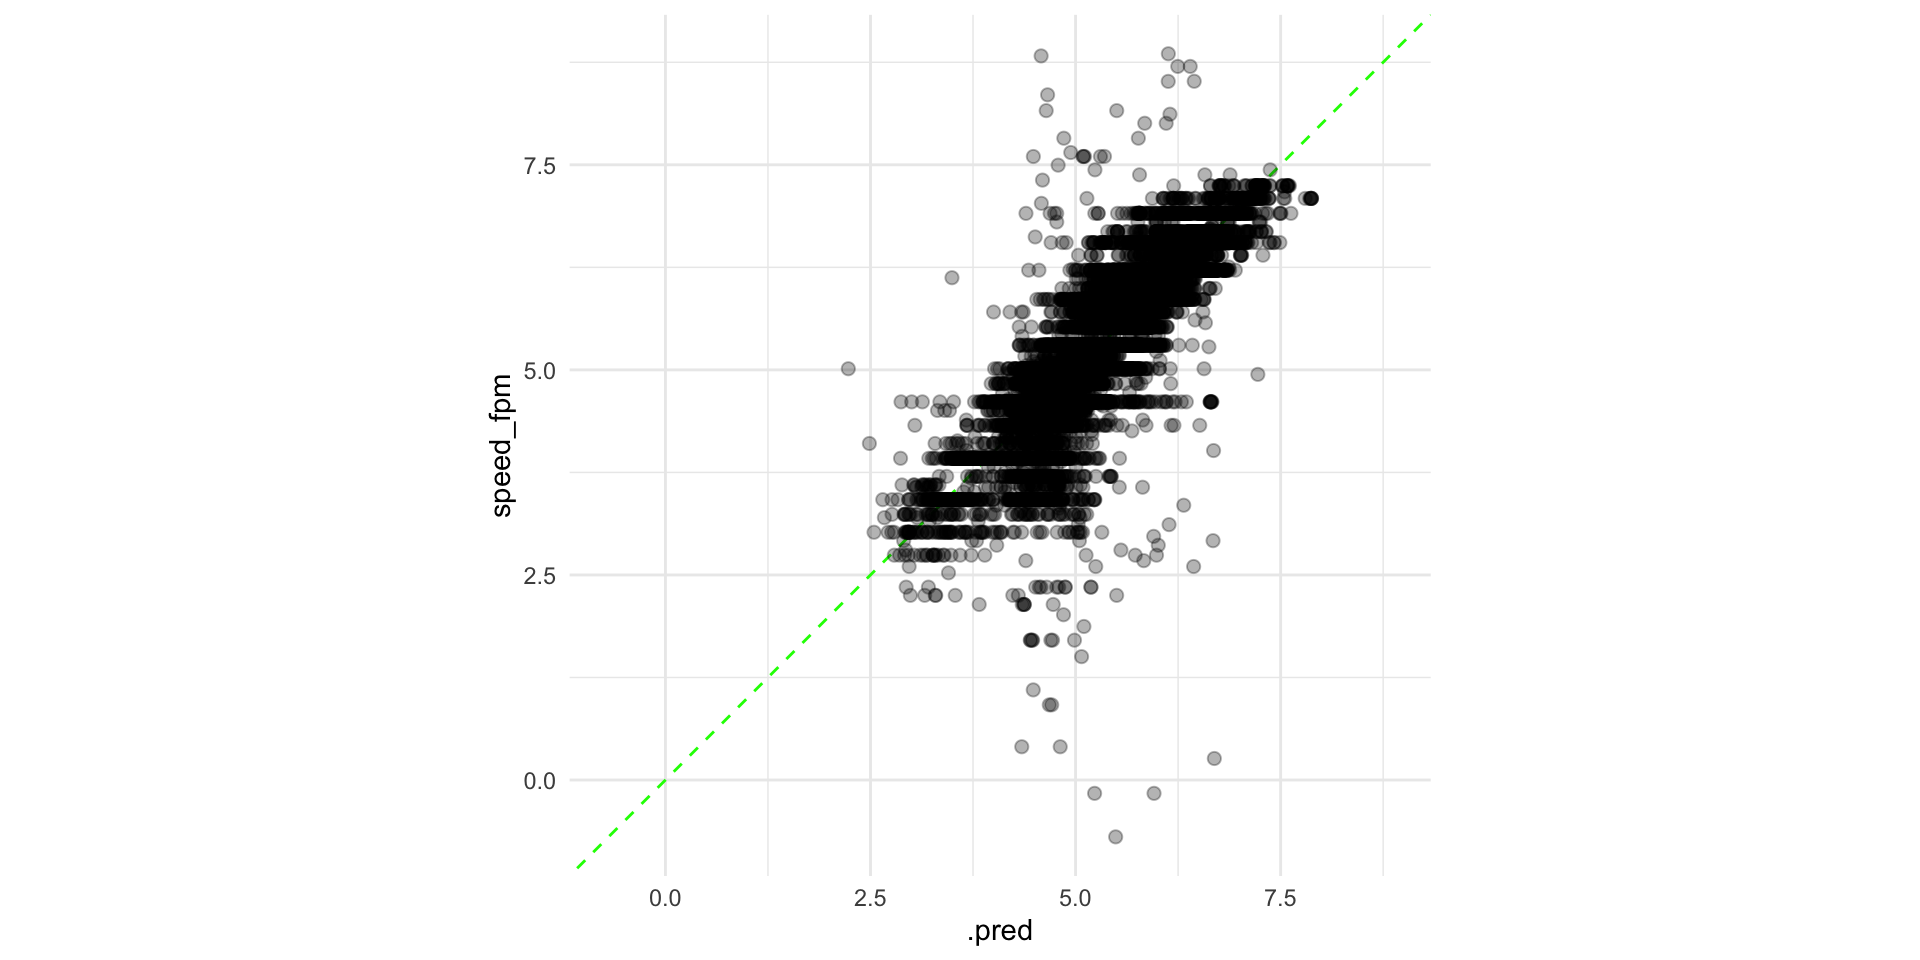
To get the holdout predictions:
elevators_pred <- collect_predictions(elevators_res)
elevators_pred %>% slice(1:4)
#> # A tibble: 4 × 5
#>   id     .pred  .row speed_fpm .config
#>   <chr>  <dbl> <int>     <dbl> <chr>
#> 1 Fold01  5.17     3      5.01 Preprocessor1_Model1
#> 2 Fold01  4.71    27      4.61 Preprocessor1_Model1
#> 3 Fold01  4.61    32      4.61 Preprocessor1_Model1
#> 4 Fold01  4.69    89      5.01 Preprocessor1_Model1
Some notes
- These models fits are independent of one another. Parallel processing can be used to significantly speed up the training process.
- The individual models can be saved so you can look at variation in the model parameters or recipes steps.
- If you are interested in a validation set, tidymodels considers that a single resample of the data. Everything else in this chapter works the same.