library(tidymodels)
#> ── Attaching packages ────────────────────────────────────── tidymodels 0.2.0 ──
#> ✔ broom        0.8.0     ✔ recipes      0.2.0
#> ✔ dials        1.0.0     ✔ rsample      0.1.1
#> ✔ dplyr        1.0.9     ✔ tibble       3.1.7
#> ✔ ggplot2      3.3.6     ✔ tidyr        1.2.0
#> ✔ infer        1.0.2     ✔ tune         0.2.0
#> ✔ modeldata    0.1.1     ✔ workflows    0.2.6
#> ✔ parsnip      1.0.0     ✔ workflowsets 0.2.1
#> ✔ purrr        0.3.4     ✔ yardstick    1.0.0
#> ── Conflicts ───────────────────────────────────────── tidymodels_conflicts() ──
#> ✖ purrr::discard() masks scales::discard()
#> ✖ dplyr::filter()  masks stats::filter()
#> ✖ dplyr::lag()     masks stats::lag()
#> ✖ recipes::step()  masks stats::step()
#> • Use tidymodels_prefer() to resolve common conflicts.Introduction to tidymodels
useR2022
Emil Hvitfelt
Our goals for this workshop
- Introduce tidymodels and its general philosophy on modeling.
- Help you become proficient with the core packages for modeling.
- Point you to places to learn more and get help.
Why tidymodels?
There are several other modeling frameworks in R that try to:
- create a uniform, cohesive, and unsurprising set of modeling APIs
Examples are caret, mlr3, and others.
- caret is more favorable for people who prefer base R/traditional interfaces.
- mlr3 is more pythonic and also has many features.
- tidymodels would probably be preferable to those who place importance on a tidy R interface, a large number of features, and the idea that the interfaces should enable the “pit of success”.
The tidymodels package
There are a lot of tidymodels packages but about 90% of the work is done by 5 packages. (rsample, recipes, parsnip, tune, and yardstick)
The best way to get started with tidymodels is to use the tidymodels meta-package. It loads the core packages plus some tidyverse packages.
Some helpful links:
- List of all tidymodels functions
- List of all parsnip models
- List of all recipe steps
The tidymodels package
Managing name conflicts
tidymodels_prefer(quiet = FALSE)
#> [conflicted] Will prefer dplyr::filter over any other package
#> [conflicted] Will prefer dplyr::select over any other package
#> [conflicted] Will prefer dplyr::slice over any other package
#> [conflicted] Will prefer dplyr::rename over any other package
#> [conflicted] Will prefer dials::neighbors over any other package
#> [conflicted] Will prefer parsnip::fit over any other package
#> [conflicted] Will prefer parsnip::bart over any other package
#> [conflicted] Will prefer parsnip::pls over any other package
#> [conflicted] Will prefer purrr::map over any other package
#> [conflicted] Will prefer recipes::step over any other package
#> [conflicted] Will prefer themis::step_downsample over any other package
#> [conflicted] Will prefer themis::step_upsample over any other package
#> [conflicted] Will prefer tune::tune over any other package
#> [conflicted] Will prefer yardstick::precision over any other package
#> [conflicted] Will prefer yardstick::recall over any other package
#> [conflicted] Will prefer yardstick::spec over any other package
#> ── Conflicts ──────────────────────────────────────────── tidymodels_prefer() ──
Base R and tidyverse differences
Base R/caret
mtcars <- mtcars[order(mtcars$cyl), ]
mtcars <- mtcars[, "mpg", drop = FALSE]


# ──────────────────────────────────────────────

mtcars$mp        # matches incomplete arg
mtcars[, "mpg"]  # a vector


# ──────────────────────────────────────────────

num_args <- function(x) length(formals(x))


num_args(caret::trainControl) +
num_args(caret:::train.default)38tidyverse/tidymodels
mtcars %>%
  arrange(cyl) %>%
  select(mpg)

# ──────────────────────────────────────────────

tb_cars <- as_tibble(mtcars)
tb_cars$mp        # fails
tb_cars[, "mpg"]  # A tibble

# ──────────────────────────────────────────────


num_args(linear_reg) + num_args(set_engine) +
  num_args(tune_grid) + num_args(control_grid) +
num_args(vfold_cv)23Example data set
Data set of the registered elevator devices in New York City provided by the Department of Buildings in response to a September 2015 FOIL request
Filtered and cleaned for our usage
Our scenario today:
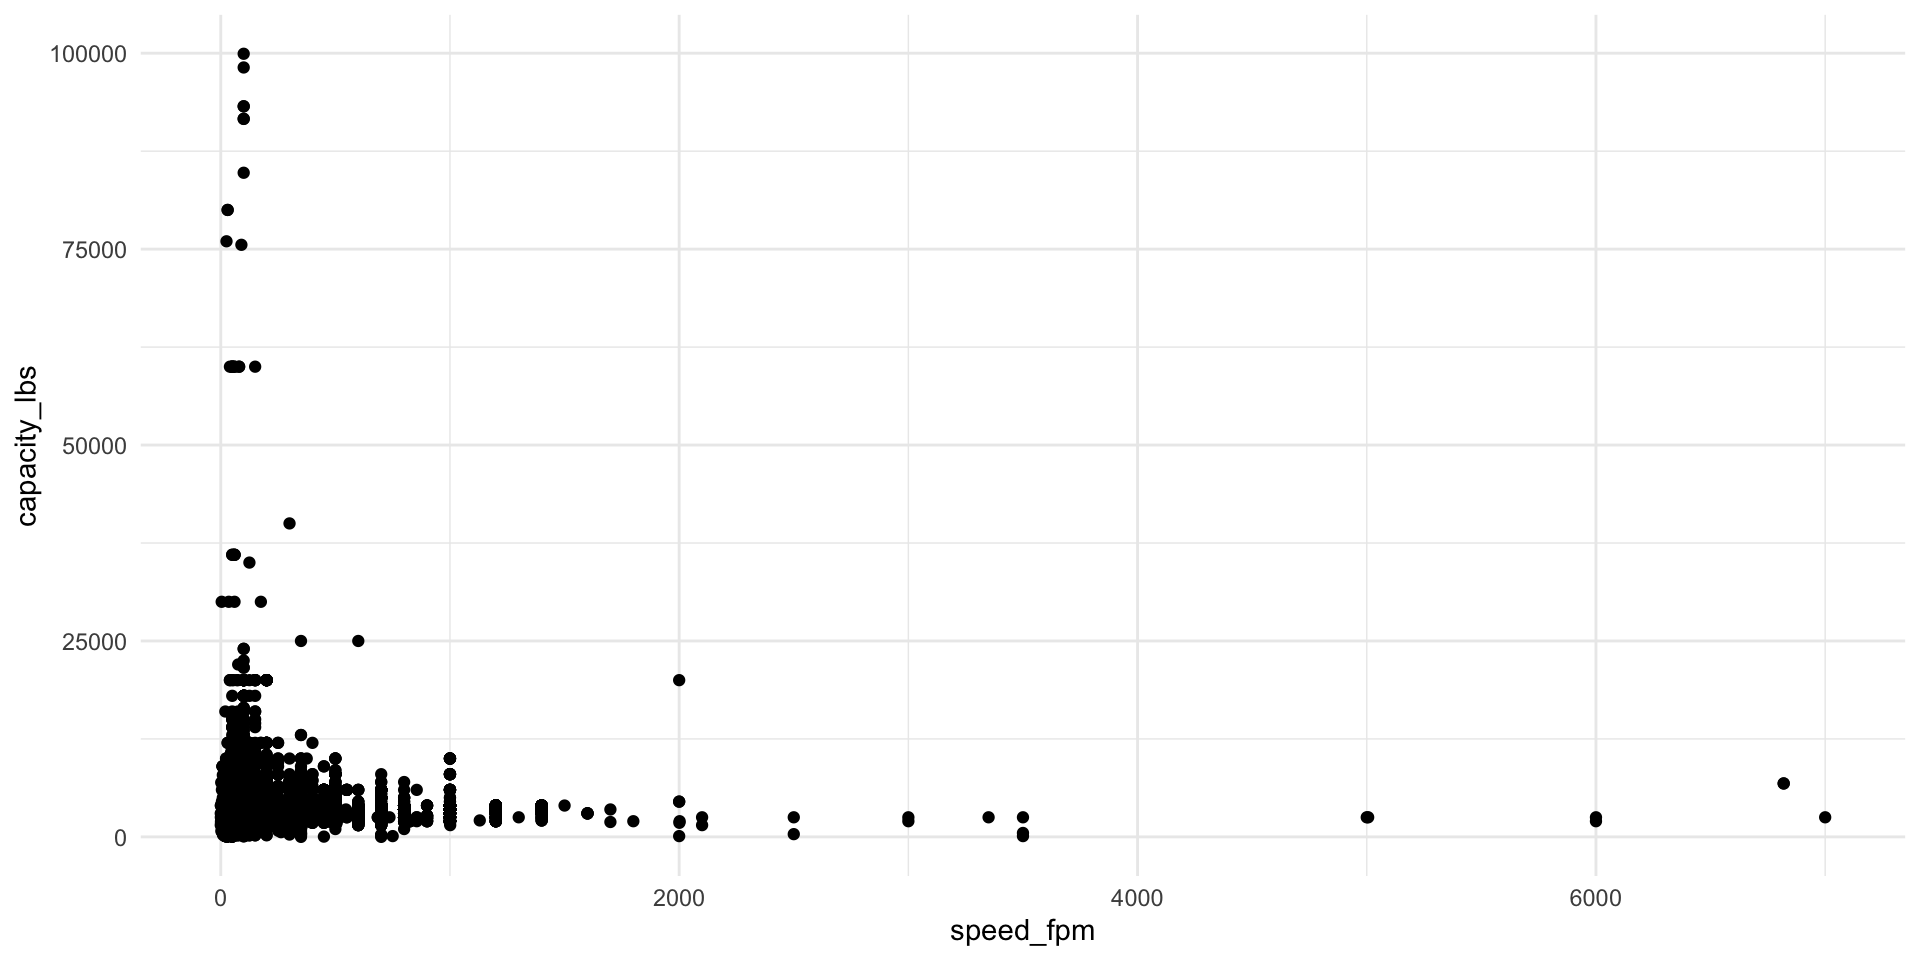
You don’t like elevators, and you want to predict how fast a given elevator is. Thus our outcome is speed

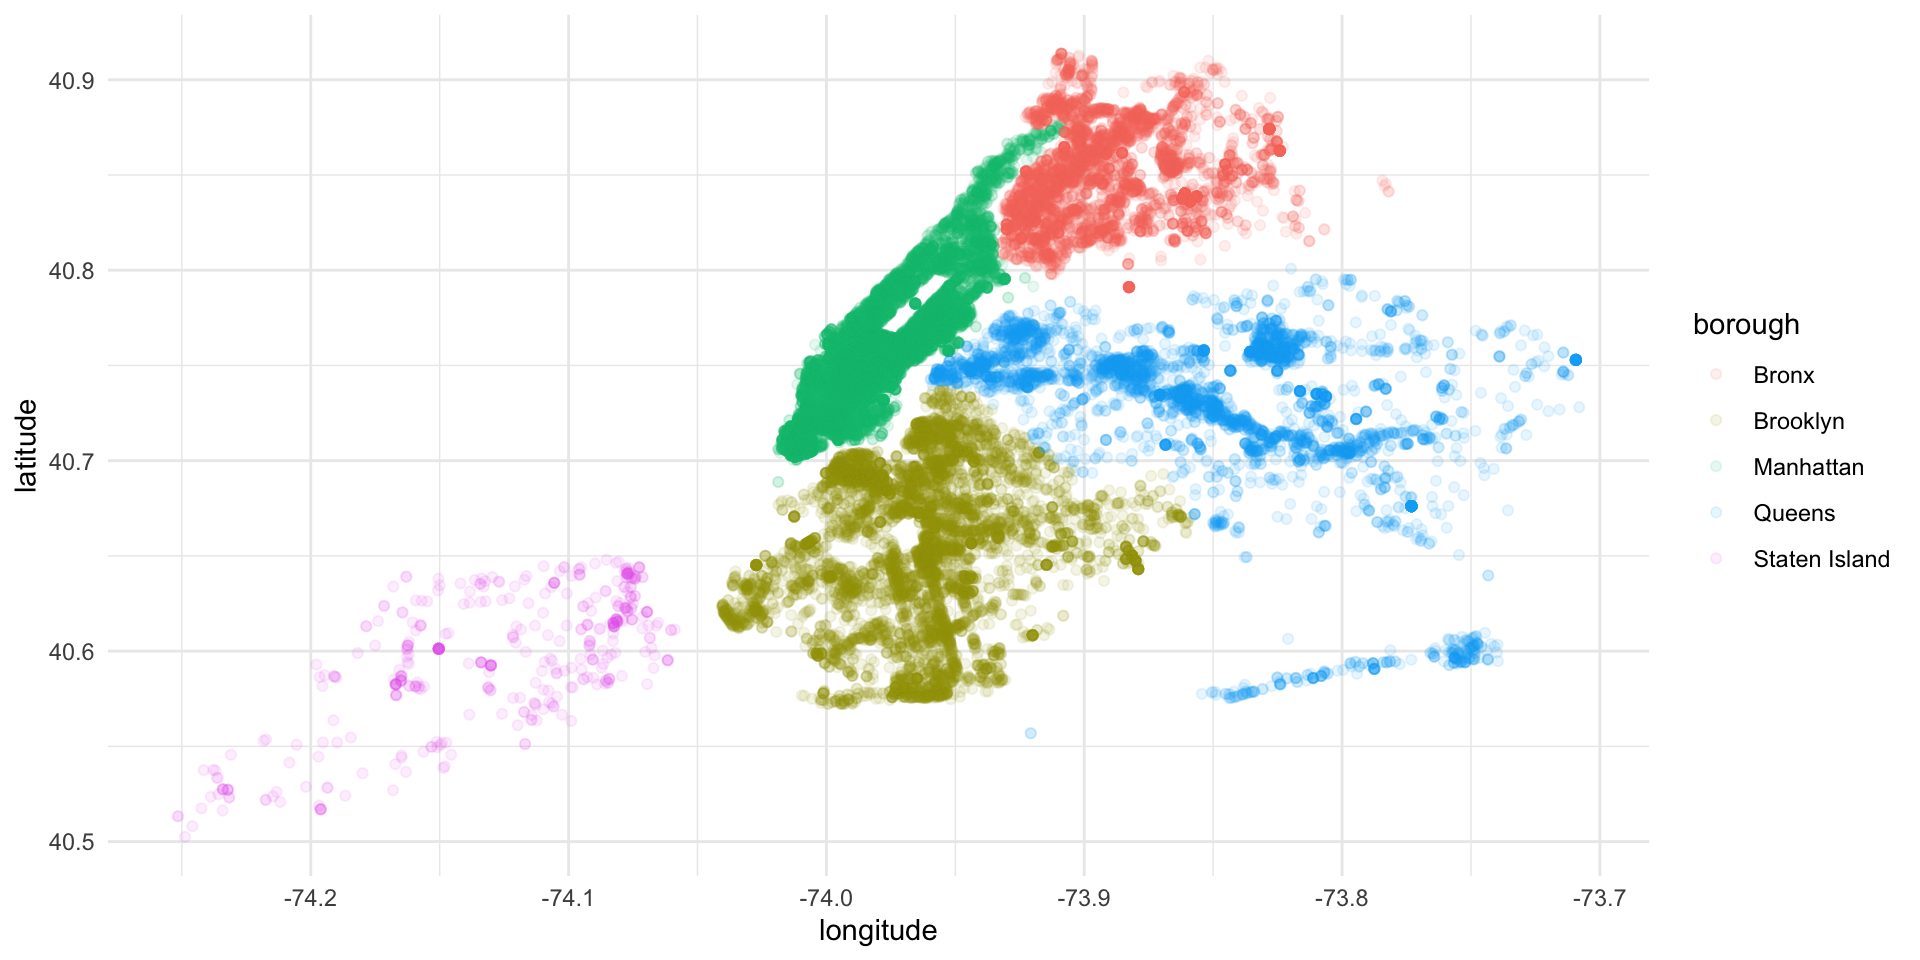
Hands-On: Explore the Data
Take a look at these data for a few minutes and see if you can find any interesting characteristics in the predictors or the outcome.
library(tidymodels)
library(elevators)
?elevators
elevators
#> # A tibble: 35,042 × 25
#>    device_number bin     tax_block tax_lot house_number street_name     zip_code
#>    <chr>         <chr>   <chr>     <chr>   <chr>        <chr>           <chr>
#>  1 1D10028       1024795 1021      26      1614         BROADWAY        10019
#>  2 1D10094       1041822 1392      25      53           E 77TH ST       10021
#>  3 1D10097       1038223 1323      1       201          E 49 ST         10017
#>  4 1D10146       1080443 1274      6       40           CENTRAL PARK S… <NA>
#>  5 1D10200       1085777 1074      24      651          TENTH AVENUE    <NA>
#>  6 1D10301       1002075 181       16      179          FRANKLIN STREET 10013
#>  7 1D10302       1010518 606       4       121          WEST 10 STREET  10011
#>  8 1D10303       1085955 1329      1       915          3 AVENUE        10022
#>  9 1D10304       1044058 1430      5       220          E. 76 ST        10021
#> 10 1D10305       1087468 1951      4       133          MORNINGSIDE AV… <NA>
#> # … with 35,032 more rows, and 18 more variables: borough <fct>,
#> #   device_type <chr>, lastper_insp_date <date>, approval_date <date>,
#> #   manufacturer <chr>, travel_distance <chr>, speed_fpm <dbl>,
#> #   capacity_lbs <dbl>, car_buffer_type <chr>, governor_type <chr>,
#> #   machine_type <chr>, safety_type <chr>, mode_operation <chr>,
#> #   floor_from <chr>, floor_to <chr>, latitude <dbl>, longitude <dbl>,
#> #   elevators_per_building <int>
Hands-On: Explore the Data
Hands-On: Explore the Data