tidyclust

expanding tidymodels to clustering

tidymodels


  • Consistent
  • Modular
  • Extensible

T

I

D

Y

C

L

U

S

T

T

I

D

Y

C

L

U

S

T

Why another package?


tidymodels was build with supervised models in mind

tidymodels


Models have outcomes


Clearly defined predict()


Easy to estimate performance

tidyclust


Models don’t have outcomes


No clearly defined predict()


No clear answer

Why another package?

There is some reimplementation in tidyclust

Experience will be as seamless as possible
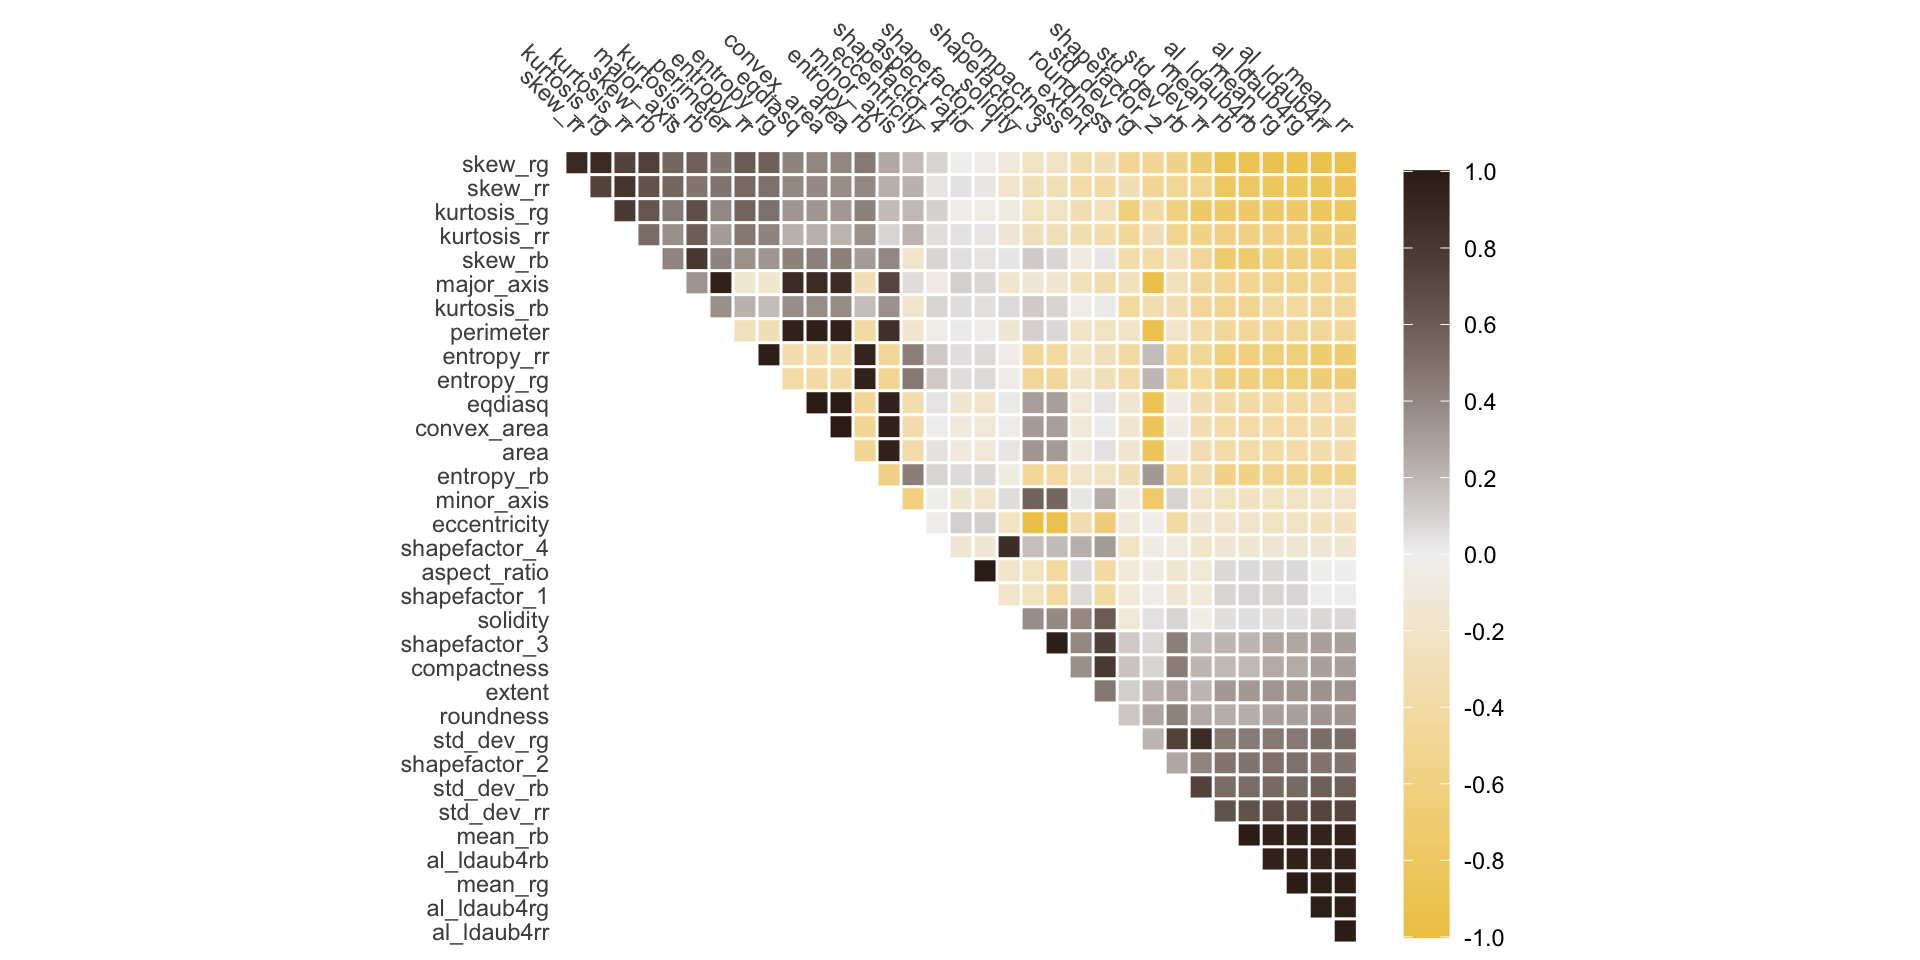
Date Fruit Data

glimpse(dates)
#> Rows: 898
#> Columns: 34
#> $ area          <dbl> 422163, 338136, 526843, 41…
#> $ perimeter     <dbl> 2378.908, 2085.144, 2647.3…
#> $ major_axis    <dbl> 837.8484, 723.8198, 940.73…
#> $ minor_axis    <dbl> 645.6693, 595.2073, 715.36…
#> $ eccentricity  <dbl> 0.6373, 0.5690, 0.6494, 0.…
#> $ eqdiasq       <dbl> 733.1539, 656.1464, 819.02…
#> $ solidity      <dbl> 0.9947, 0.9974, 0.9962, 0.…
#> $ convex_area   <dbl> 424428, 339014, 528876, 41…
#> $ extent        <dbl> 0.7831, 0.7795, 0.7657, 0.…
#> $ aspect_ratio  <dbl> 1.2976, 1.2161, 1.3150, 1.…
#> $ roundness     <dbl> 0.9374, 0.9773, 0.9446, 0.…
#> $ compactness   <dbl> 0.8750, 0.9065, 0.8706, 0.…
#> $ shapefactor_1 <dbl> 0.0020, 0.0021, 0.0018, 0.…
#> $ shapefactor_2 <dbl> 0.0015, 0.0018, 0.0014, 0.…
#> $ shapefactor_3 <dbl> 0.7657, 0.8218, 0.7580, 0.…
#> $ shapefactor_4 <dbl> 0.9936, 0.9993, 0.9968, 0.…
#> $ mean_rr       <dbl> 117.4466, 100.0578, 130.95…
#> $ mean_rg       <dbl> 109.9085, 105.6314, 118.57…
#> $ mean_rb       <dbl> 95.6774, 95.6610, 103.8750…
#> $ std_dev_rr    <dbl> 26.5152, 27.2656, 29.7036,…
#> $ std_dev_rg    <dbl> 23.0687, 23.4952, 24.6216,…
#> $ std_dev_rb    <dbl> 30.1230, 28.1229, 33.9053,…
#> $ skew_rr       <dbl> -0.5661, -0.2328, -0.7152,…
#> $ skew_rg       <dbl> -0.0114, 0.1349, -0.1059, …
#> $ skew_rb       <dbl> 0.6019, 0.4134, 0.9183, 1.…
#> $ kurtosis_rr   <dbl> 3.2370, 2.6228, 3.7516, 5.…
#> $ kurtosis_rg   <dbl> 2.9574, 2.6350, 3.8611, 8.…
#> $ kurtosis_rb   <dbl> 4.2287, 3.1704, 4.7192, 8.…
#> $ entropy_rr    <dbl> -59191263232, -34233065472…
#> $ entropy_rg    <dbl> -50714214400, -37462601728…
#> $ entropy_rb    <dbl> -39922372608, -31477794816…
#> $ al_ldaub4rr   <dbl> 58.7255, 50.0259, 65.4772,…
#> $ al_ldaub4rg   <dbl> 54.9554, 52.8168, 59.2860,…
#> $ al_ldaub4rb   <dbl> 47.8400, 47.8315, 51.9378,…

Date Fruit Data

Specifying a clustering model

k_means()
#> K Means Cluster Specification (partition)
#> 
#> Computational engine: stats

Specifying a clustering model

k_means(num_clusters = 5) %>%
  set_engine("ClusterR", max_iters = 1000)
#> K Means Cluster Specification (partition)
#> 
#> Main Arguments:
#>   num_clusters = 5
#> 
#> Engine-Specific Arguments:
#>   max_iters = 1000
#> 
#> Computational engine: ClusterR

Specifying a clustering model

kmeans_spec <- k_means(num_clusters = 5)

rec_spec <- recipe(~., data = dates) %>%
  step_normalize(all_numeric_predictors()) %>%
  step_pca(all_numeric_predictors(), threshold = 0.9)

kmeans_wf <- workflow(rec_spec, kmeans_spec)

kmeans_fit <- fit(kmeans_wf, data = dates)

cluster assignment + clusters + prediction

extract_cluster_assignment(kmeans_fit)
#> # A tibble: 898 × 1
#>    .cluster 
#>    <fct>    
#>  1 Cluster_1
#>  2 Cluster_2
#>  3 Cluster_1
#>  4 Cluster_2
#>  5 Cluster_2
#>  6 Cluster_2
#>  7 Cluster_1
#>  8 Cluster_2
#>  9 Cluster_1
#> 10 Cluster_1
#> # … with 888 more rows
#> # ℹ Use `print(n = ...)` to see more rows

cluster assignment + clusters + prediction

extract_centroids(kmeans_fit)
#> # A tibble: 5 × 7
#>   .cluster     PC1    PC2    PC3     PC4      PC5
#>   <chr>      <dbl>  <dbl>  <dbl>   <dbl>    <dbl>
#> 1 Cluster_1  2.15   3.18   1.42   0.0640 -0.342  
#> 2 Cluster_2 -5.66  -1.50   0.806  0.298  -0.361  
#> 3 Cluster_3  3.80  -2.82  -0.786 -0.159  -0.00248
#> 4 Cluster_4  0.934 -0.774 -0.102  0.498   0.0410 
#> 5 Cluster_5 -1.99   3.37  -2.05  -1.02    1.06   
#> # … with 1 more variable: PC6 <dbl>
#> # ℹ Use `colnames()` to see all variable names

cluster assignment + clusters + prediction

predict(kmeans_fit, new_data = dates[4:6, ])
#> # A tibble: 3 × 1
#>   .pred_cluster
#>   <fct>        
#> 1 Cluster_2    
#> 2 Cluster_2    
#> 3 Cluster_2

Metrics

tot_wss(kmeans_fit, new_data = dates)
#> # A tibble: 1 × 3
#>   .metric .estimator .estimate
#>   <chr>   <chr>          <dbl>
#> 1 tot_wss standard       9329.

Metrics

my_metrics <- cluster_metric_set(tot_wss, tot_sse)

my_metrics(kmeans_fit, new_data = dates)
#> # A tibble: 2 × 3
#>   .metric .estimator .estimate
#>   <chr>   <chr>          <dbl>
#> 1 tot_wss standard       9329.
#> 2 tot_sse standard      27539.

tuning

kmeans_spec <- k_means(num_clusters = tune())

kmeans_wf <- kmeans_wf %>% 
  update_model(kmeans_spec)

grid <- tibble(num_clusters = 1:10)

set.seed(2022)
boots <- bootstraps(dates, times = 5)

tuning

res <- tune_cluster(
  kmeans_wf,
  resamples = boots,
  grid = grid,
  metrics = cluster_metric_set(tot_wss)
)

tuning

collect_metrics(res)
#> # A tibble: 10 × 7
#>    num_clus…¹ .metric .esti…²   mean     n std_err
#>         <int> <chr>   <chr>    <dbl> <int>   <dbl>
#>  1          1 tot_wss standa… 27830.     5    119.
#>  2          2 tot_wss standa… 18828.     5    815.
#>  3          3 tot_wss standa… 12454.     5    206.
#>  4          4 tot_wss standa… 10086.     5    207.
#>  5          5 tot_wss standa…  8865.     5    190.
#>  6          6 tot_wss standa…  8236.     5    404.
#>  7          7 tot_wss standa…  7211.     5    366.
#>  8          8 tot_wss standa…  6498.     5    365.
#>  9          9 tot_wss standa…  5920.     5    355.
#> 10         10 tot_wss standa…  5918.     5    338.
#> # … with 1 more variable: .config <chr>, and
#> #   abbreviated variable names ¹​num_clusters,
#> #   ²​.estimator
#> # ℹ Use `colnames()` to see all variable names

Thank You!

  • Please use the package
  • give us feedback
  • make feature requests

github.com/EmilHvitfeldt/tidyclust