Make a color lighter
Usage
clr_lighten(col, shift = 0.5, space = c("HCL", "HSL", "combined"))Arguments
- col
A
colorsobject (seecolor()) or a vector of any of the three kinds of R color specifications, i.e., either a color name (as listed bygrDevices::colors()), a hexadecimal string (seecol2rgb()), or a positive integerimeaninggrDevices::palette()[i].- shift
A number between 0 and 1. 0 will do zero lightening, and 1 will do complete lightening, turning the color to white. Defaults to 0.5.
- space
A character string specifying the color space in which adjustment happens. Can be either "HCL", "HSL" or "combined". Defaults to "HCL".
Details
The colors will be transformed to HSL color space (hue, saturation,
lightness) where the lightness of the color will be modified. The lightness
of a color takes a value between 0 and 1, with 0 being black and 1 being
white. shift takes a value between 0 and 1, where 0 means the lightness
stays unchanged and 1 means completely white. As an example, if the lightness
of the color is 0.6 and shift is 0.5, the lightness will be set to the
halfway point between 0.6 and 1 which is 0.8.
If space = "HSL" then the colors are transformed to HSL space where
the lightness value L is adjusted. If space = "HCL" then the colors are
transformed to Cylindrical HCL space where the luminance value L is adjusted.
If space = "combined" then the colors are transformed into HSL and
Cylindrical HCL space. Where the color adjusting is happening HLS is copied
to the values in the HCL transformation. Thus, the "combined" transformation
adjusts the luminance in HCL space and chroma in HSL space. For more
information regarding use of color spaces, please refer to the colorspace
paper https://arxiv.org/abs/1903.06490.
Examples
# Using linear shift
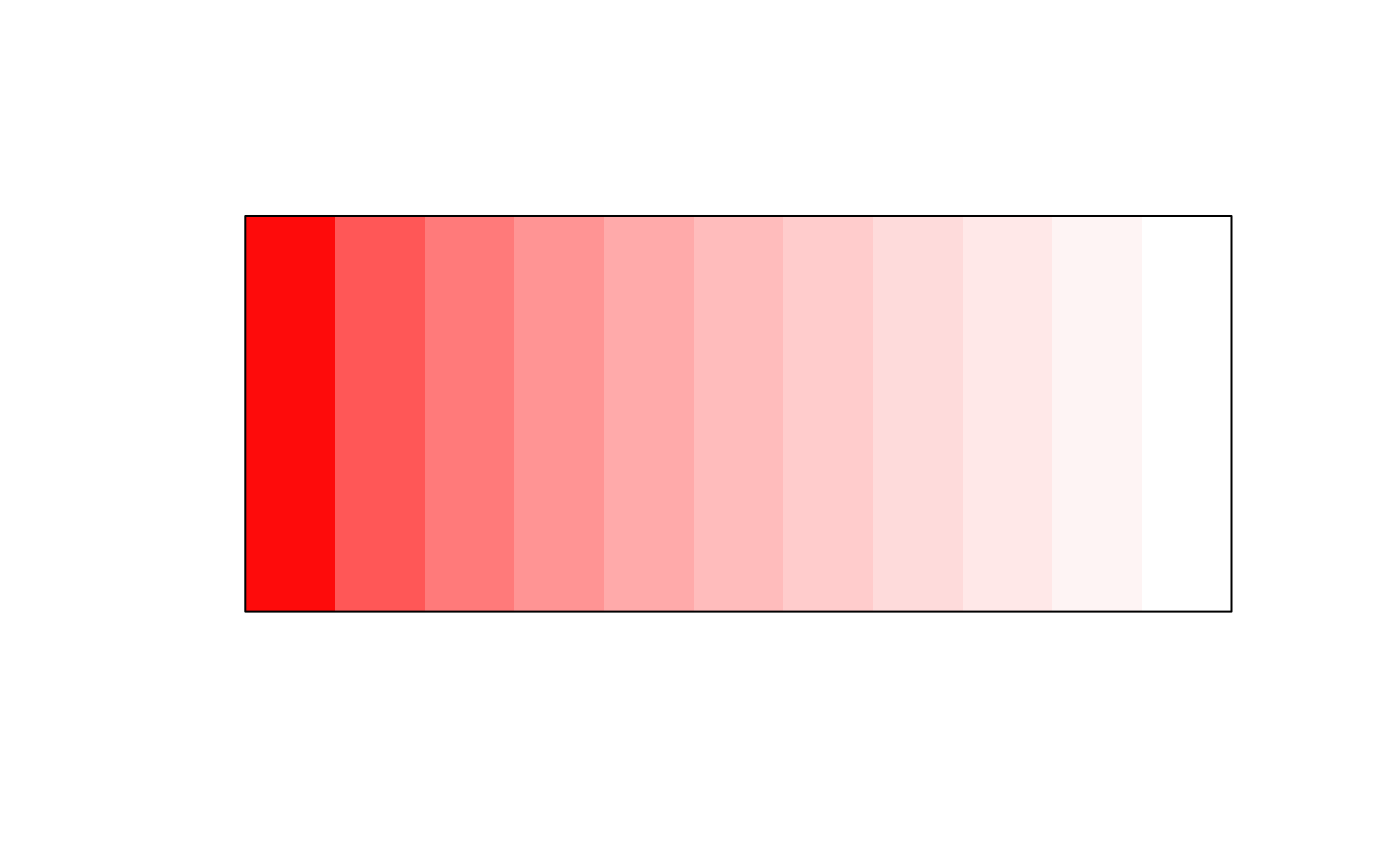
plot(clr_lighten(rep("red", 11), shift = seq(0, 1, 0.1)))
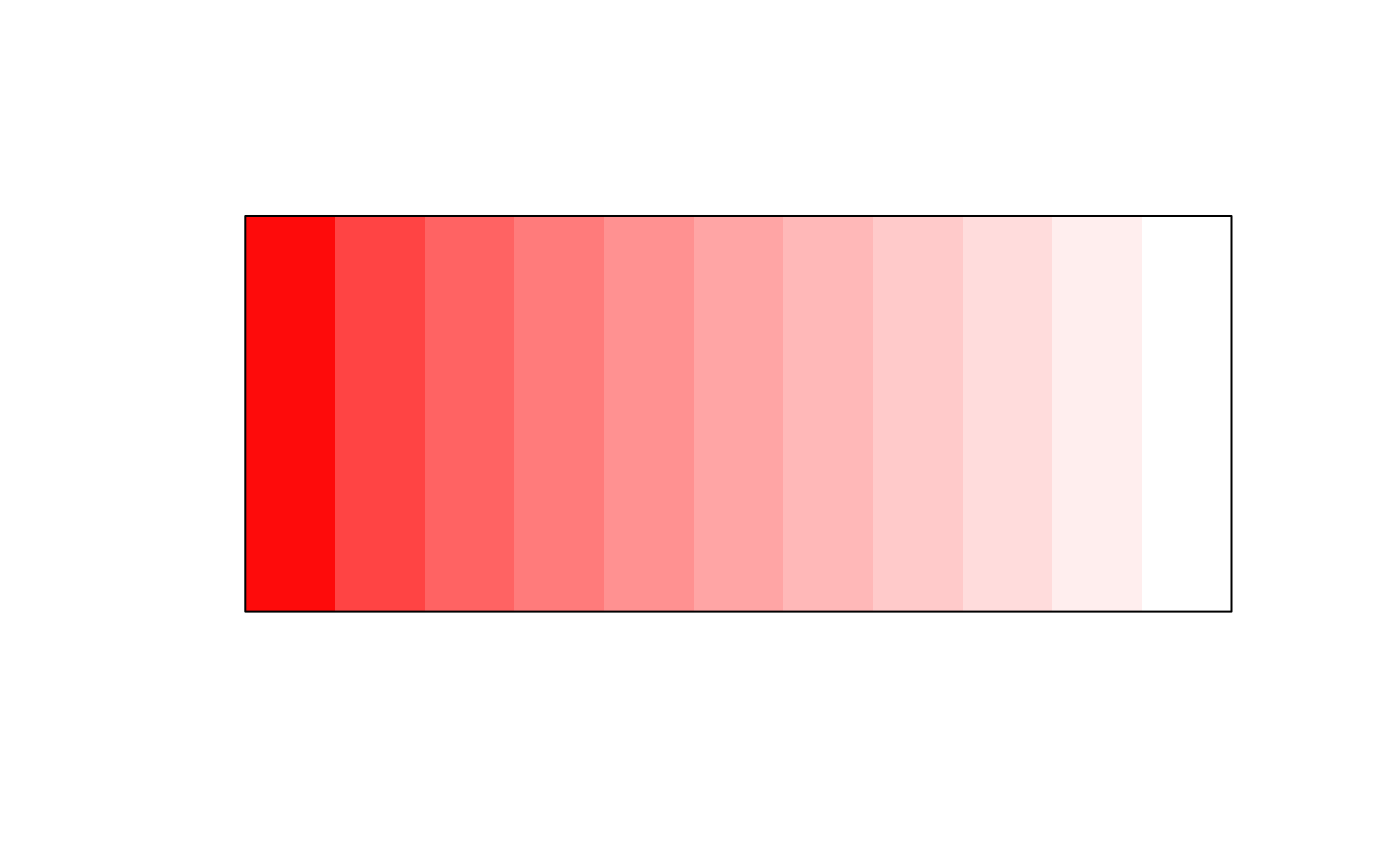 plot(clr_lighten(rep("red", 11), shift = seq(0, 1, 0.1), space = "HSL"))
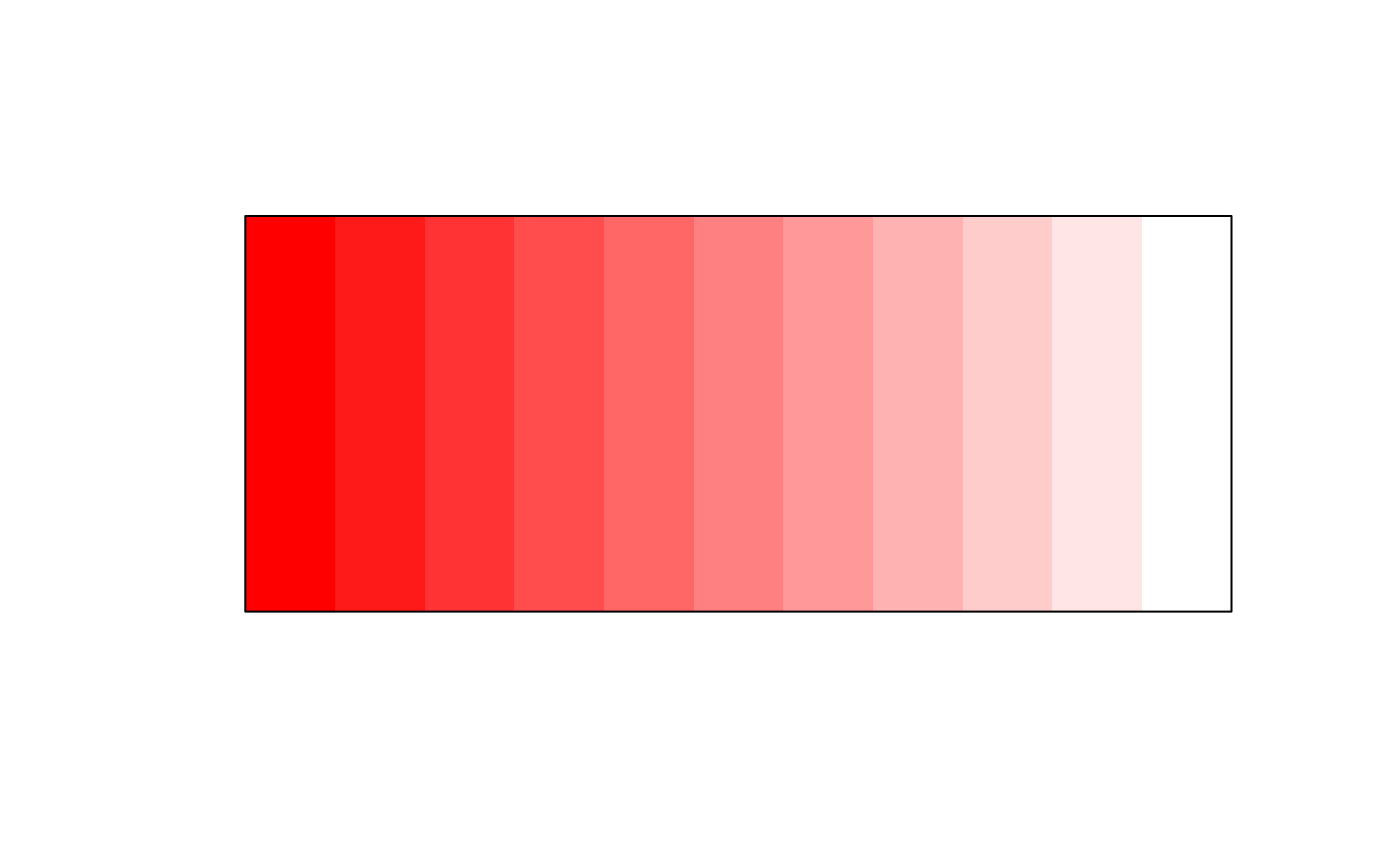 plot(clr_lighten(rep("red", 11), shift = seq(0, 1, 0.1), space = "combined"))
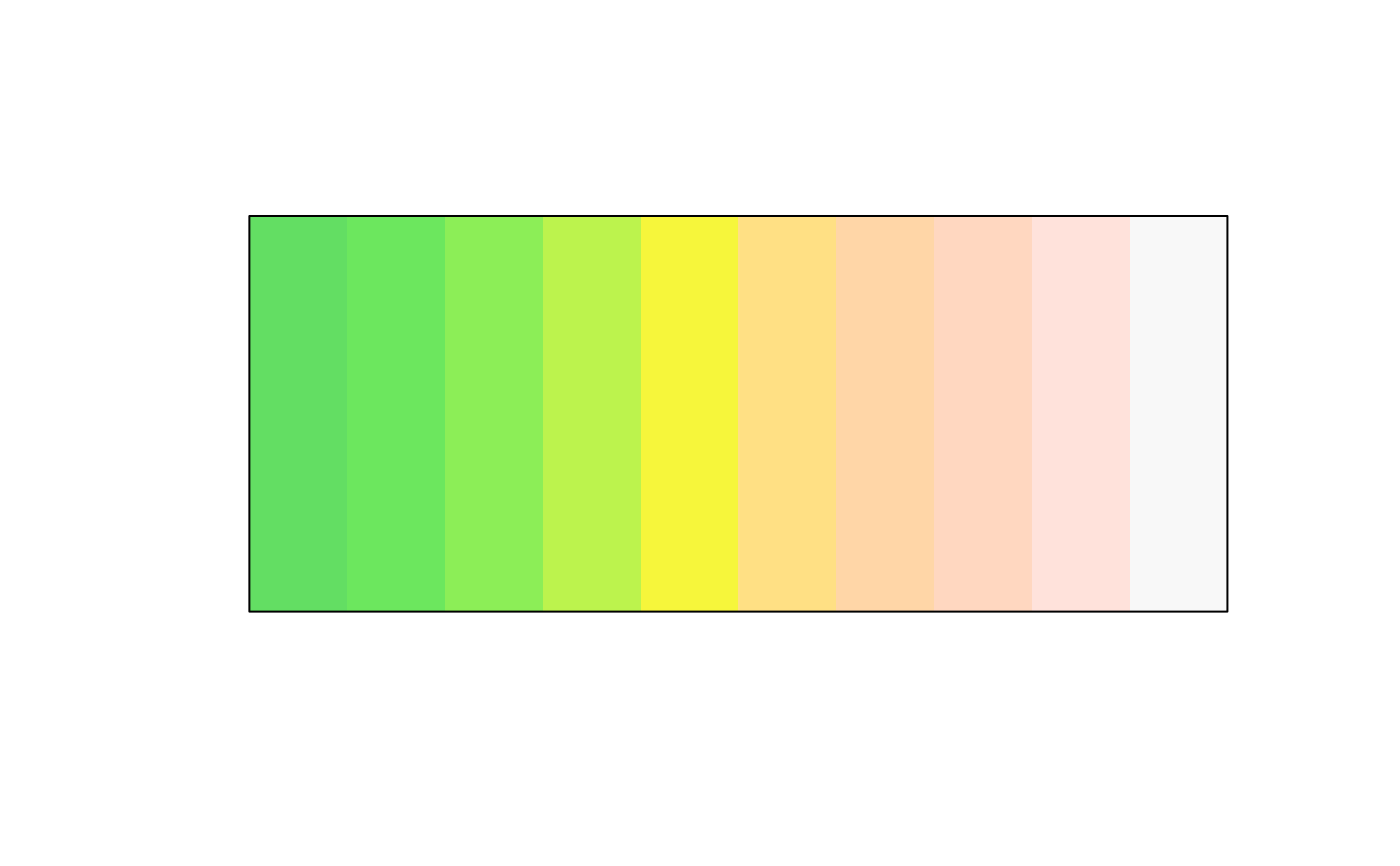
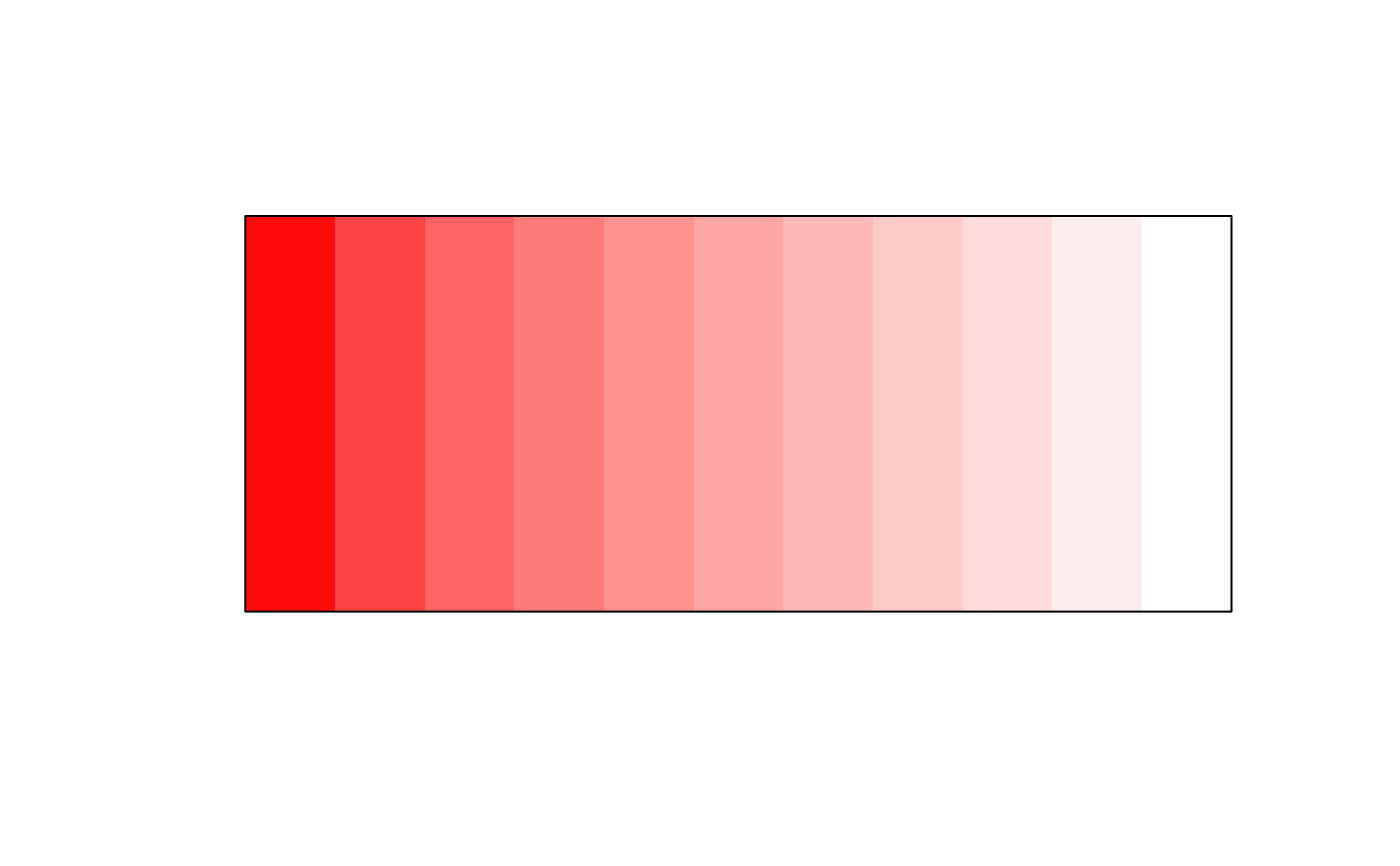 plot(clr_lighten(terrain.colors(10)))
 # Using exponential shifts
plot(clr_lighten(rep("red", 11), shift = log(seq(1, exp(1), length.out = 11))))
