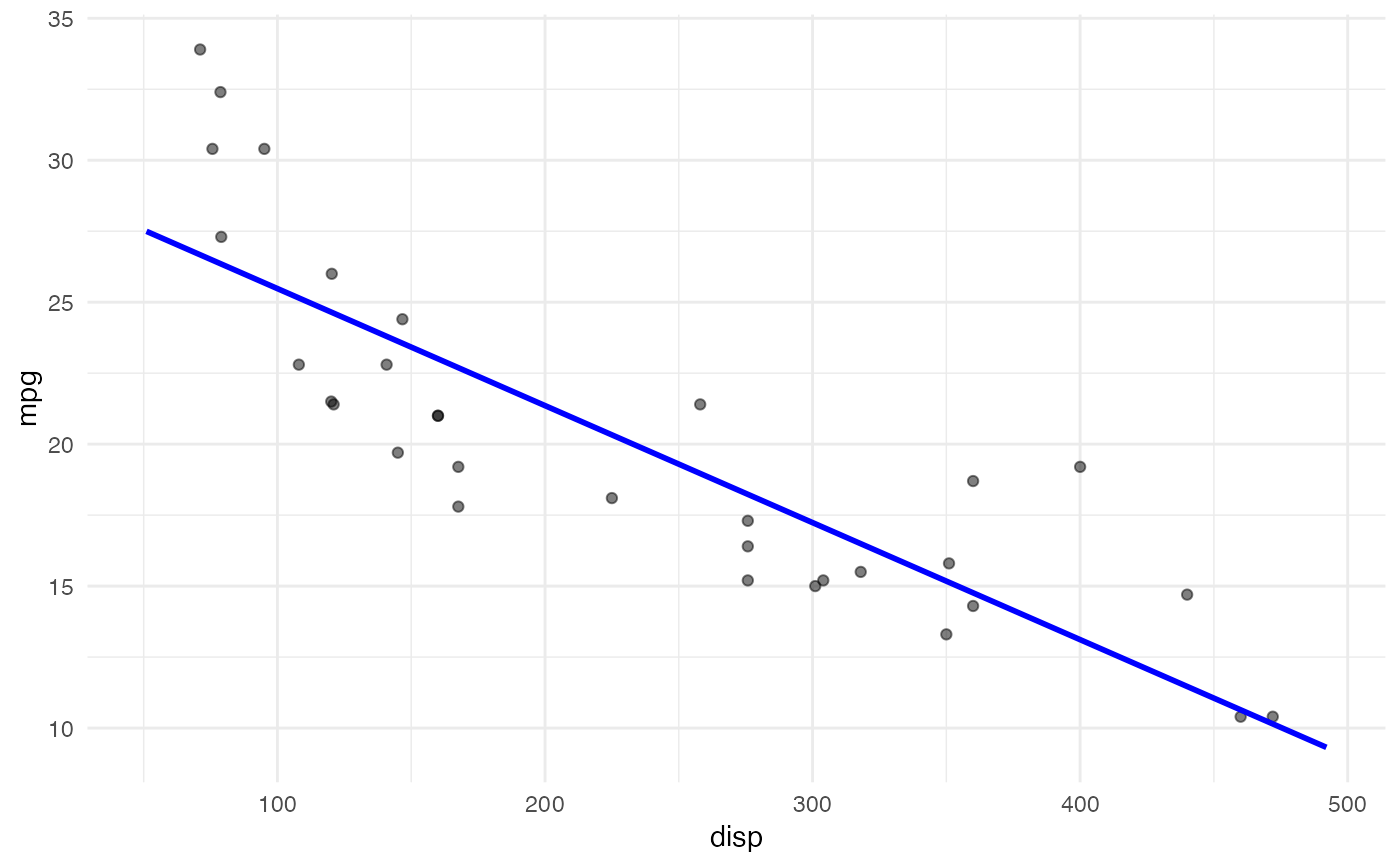
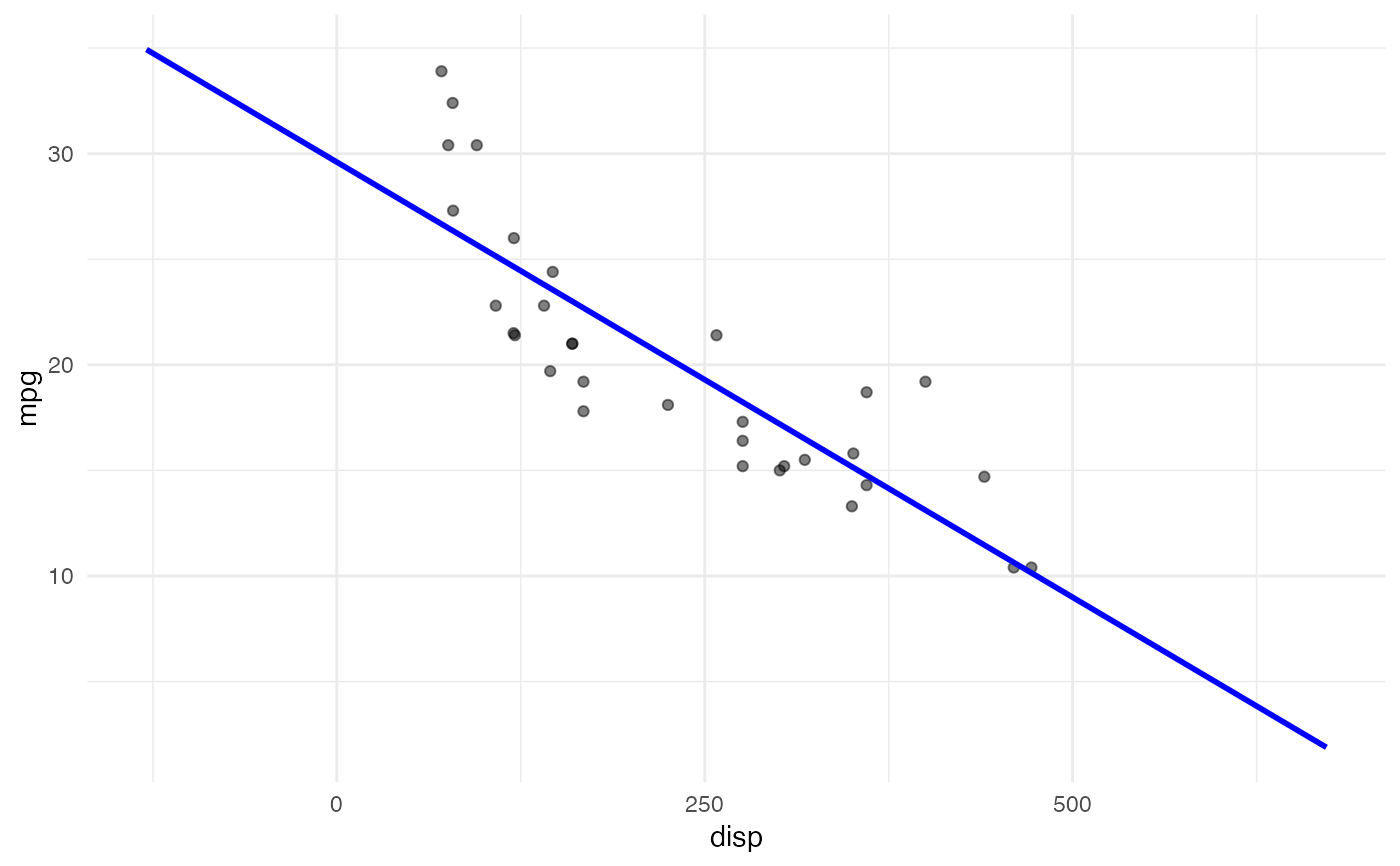
Draw fitted regression line
viz_fitted_line.RdThis function is mostly useful in an educational setting. Can only be used with trained workflow objects with 1 numeric predictor variable.
viz_fitted_line(
  x,
  new_data,
  resolution = 100,
  expand = 0.1,
  color = "blue",
  size = 1
)
Arguments
| x | trained `workflows::workflow` object. |
|---|---|
| new_data | A data frame or tibble for whom the preprocessing will be applied. |
| resolution | Number of squared in grid. Defaults to 100. |
| expand | Expansion rate. Defaults to 0.1. This means that the width of the plotting area is 10 percent wider then the data. |
| color | Character, color of the fitted line. Passed to `geom_line()`. Defaults to `"blue"`. |
| size | Numeric, size of the fitted line. Passed to `geom_line()`. Defaults to `1`. |
Value
`ggplot2::ggplot` object
Details
The chart have been minimally modified to allow for easier styling.
Examples
library(parsnip) library(workflows) lm_spec <- linear_reg() %>% set_mode("regression") %>% set_engine("lm") lm_fit <- workflow() %>% add_formula(mpg ~ disp) %>% add_model(lm_spec) %>% fit(mtcars) viz_fitted_line(lm_fit, mtcars)viz_fitted_line(lm_fit, mtcars, expand = 1)

