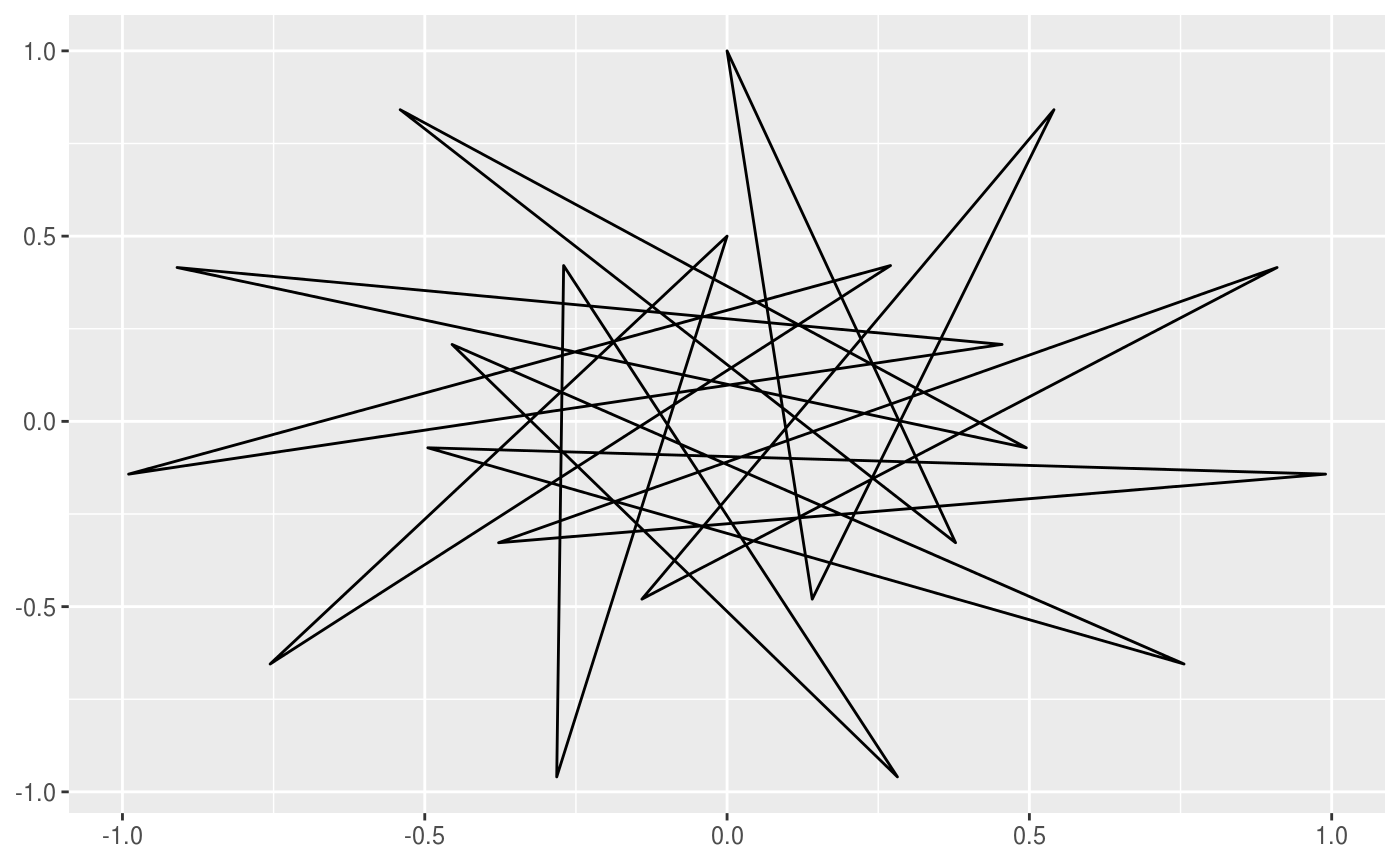
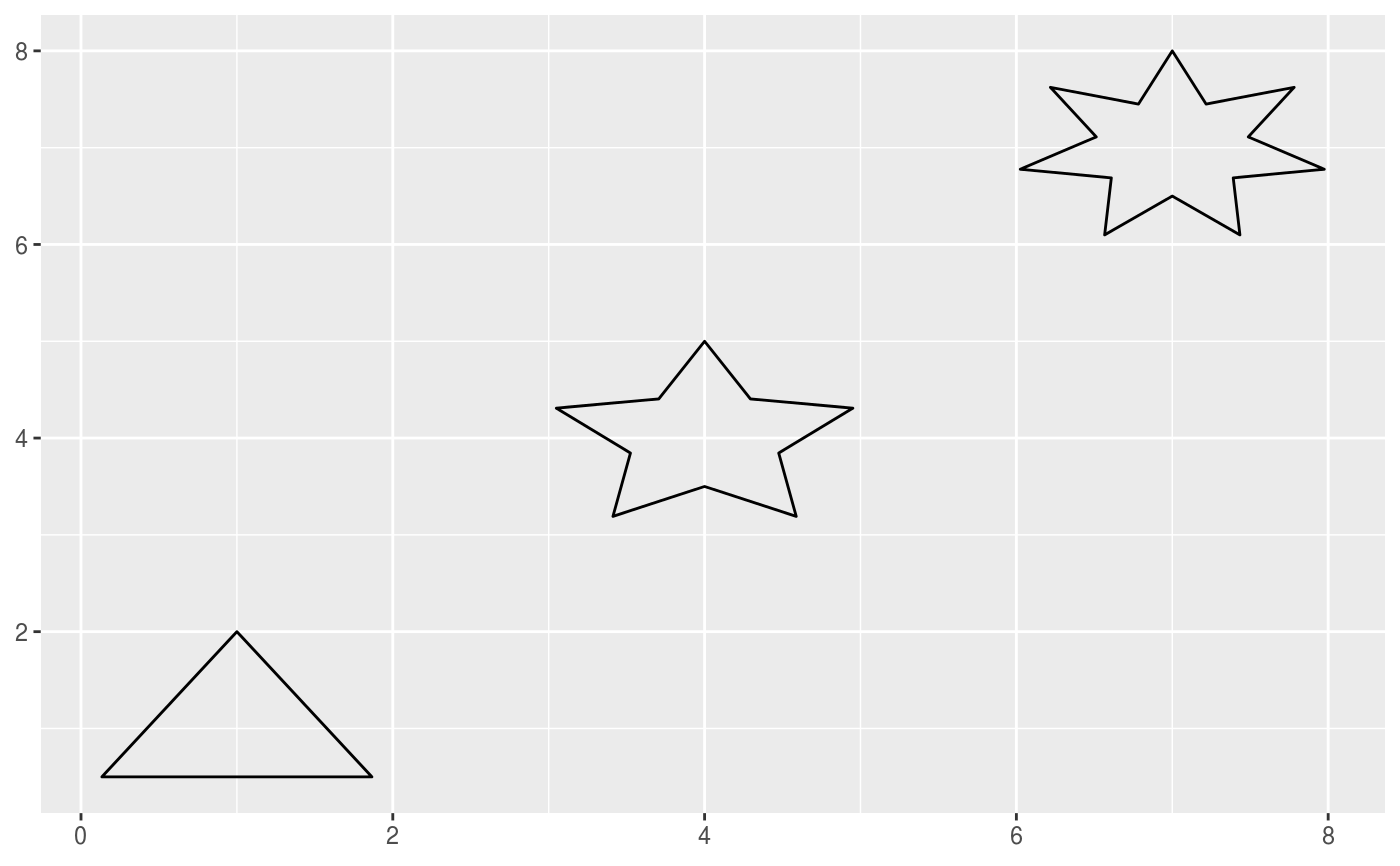
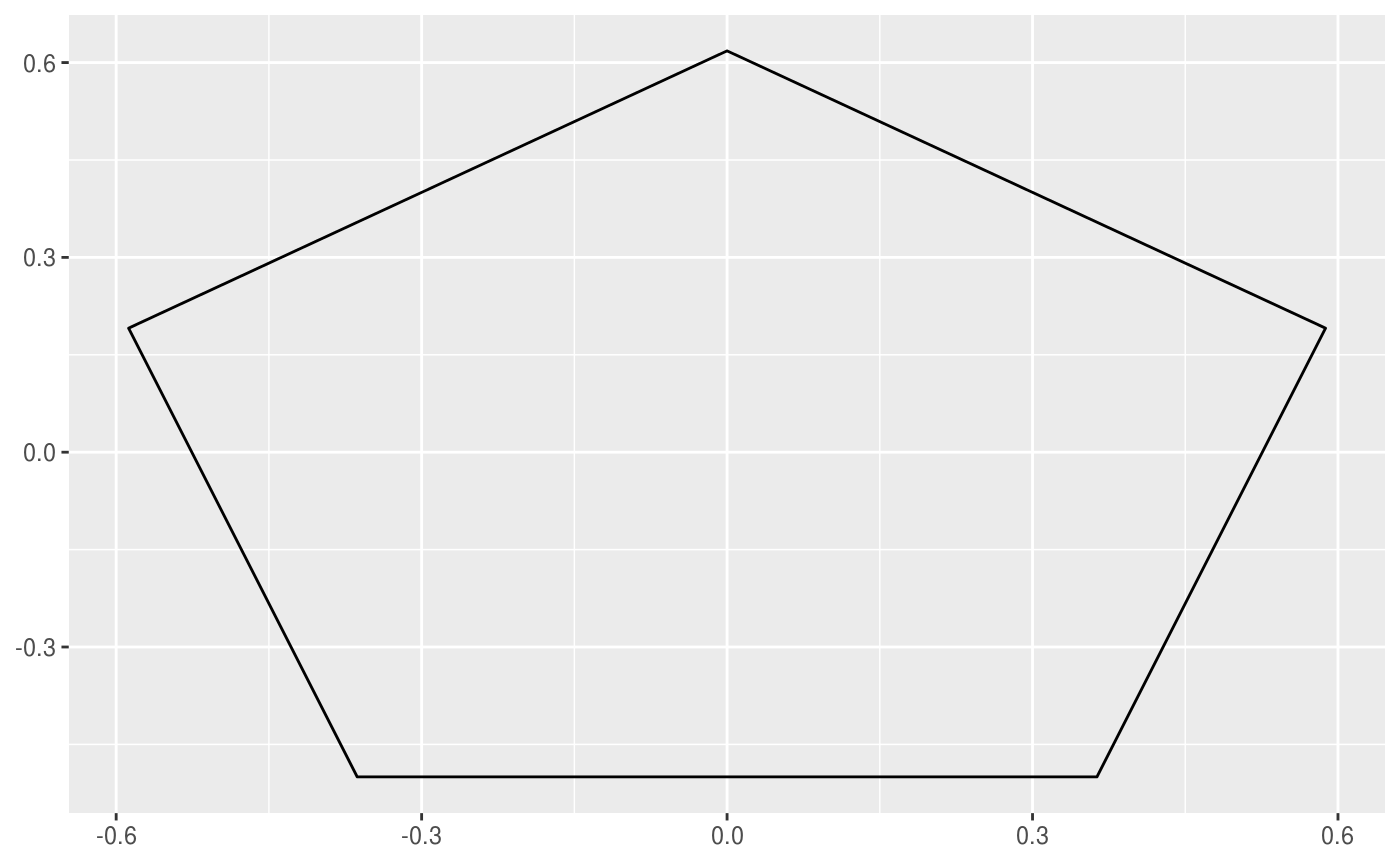
This geom allows you to draw the star curve.
stat_star(mapping = NULL, data = NULL, geom = "star",
  position = "identity", n_points = 360, na.rm = FALSE,
  show.legend = NA, inherit.aes = TRUE, ...)

geom_star(mapping = NULL, data = NULL, stat = "star",
  position = "identity", n_points = 360, na.rm = FALSE,
  show.legend = NA, inherit.aes = TRUE, ...)
Arguments
| mapping | Set of aesthetic mappings created by |
|---|---|
| data | The data to be displayed in this layer. There are three options: If A A |
| geom | The geometric object to use display the data |
| position | Position adjustment, either as a string, or the result of a call to a position adjustment function. |
| n_points | The number of points to sample along the curve. |
| na.rm | If |
| show.legend | logical. Should this layer be included in the legends?
|
| inherit.aes | If |
| ... | Other arguments passed on to |
| stat | The statistical transformation to use on the data for this layer, as a string. |
Aesthetics
geom_arc understand the following aesthetics (required aesthetics are in bold):
- **n_tips** - r_min - r_max - offset - x0 - y0 - xscale - yscale - rotation - color - fill - size - linetype - alpha - lineend
Computed variables
- x, y
The coordinates for the points along the star curve
Examples
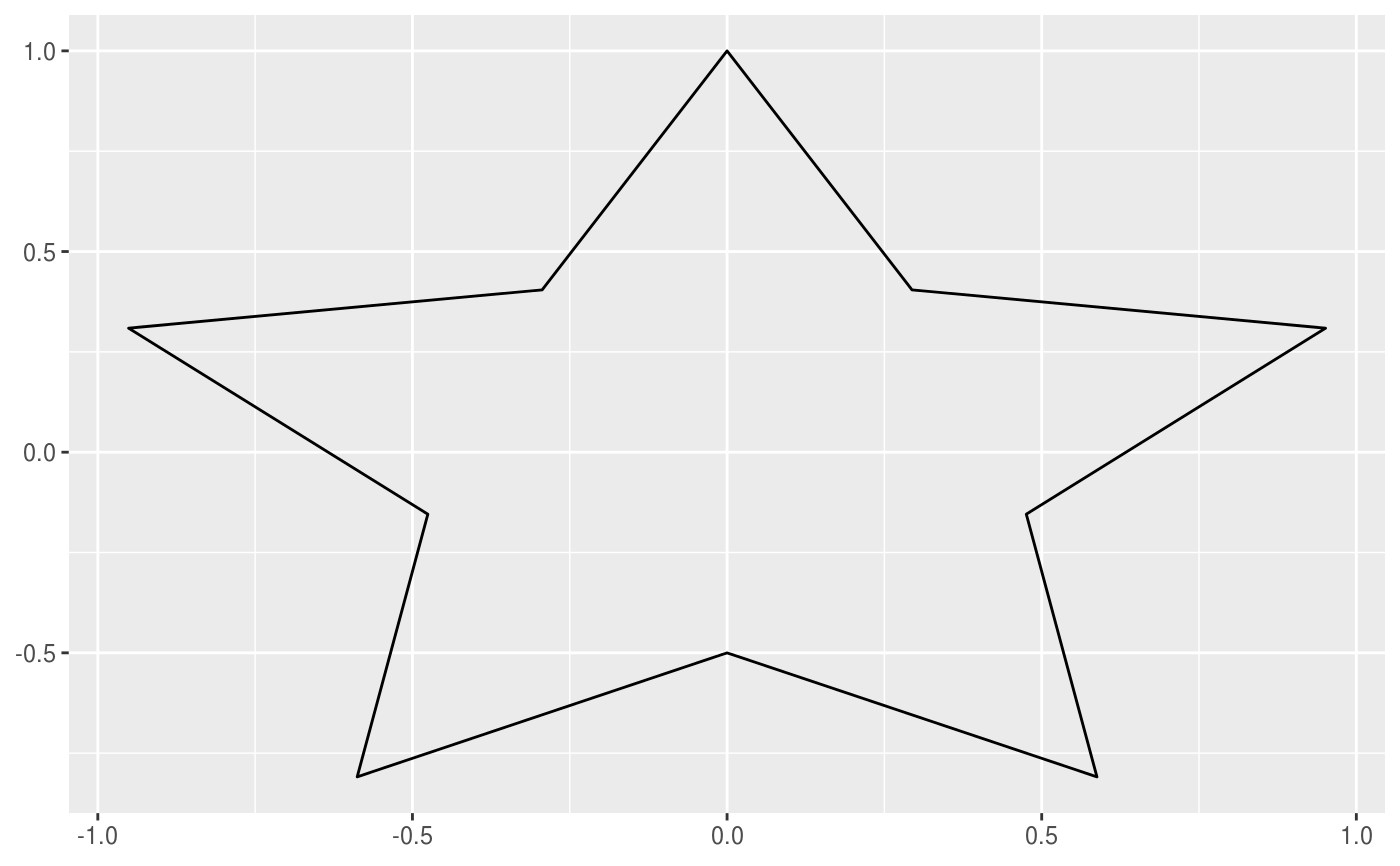
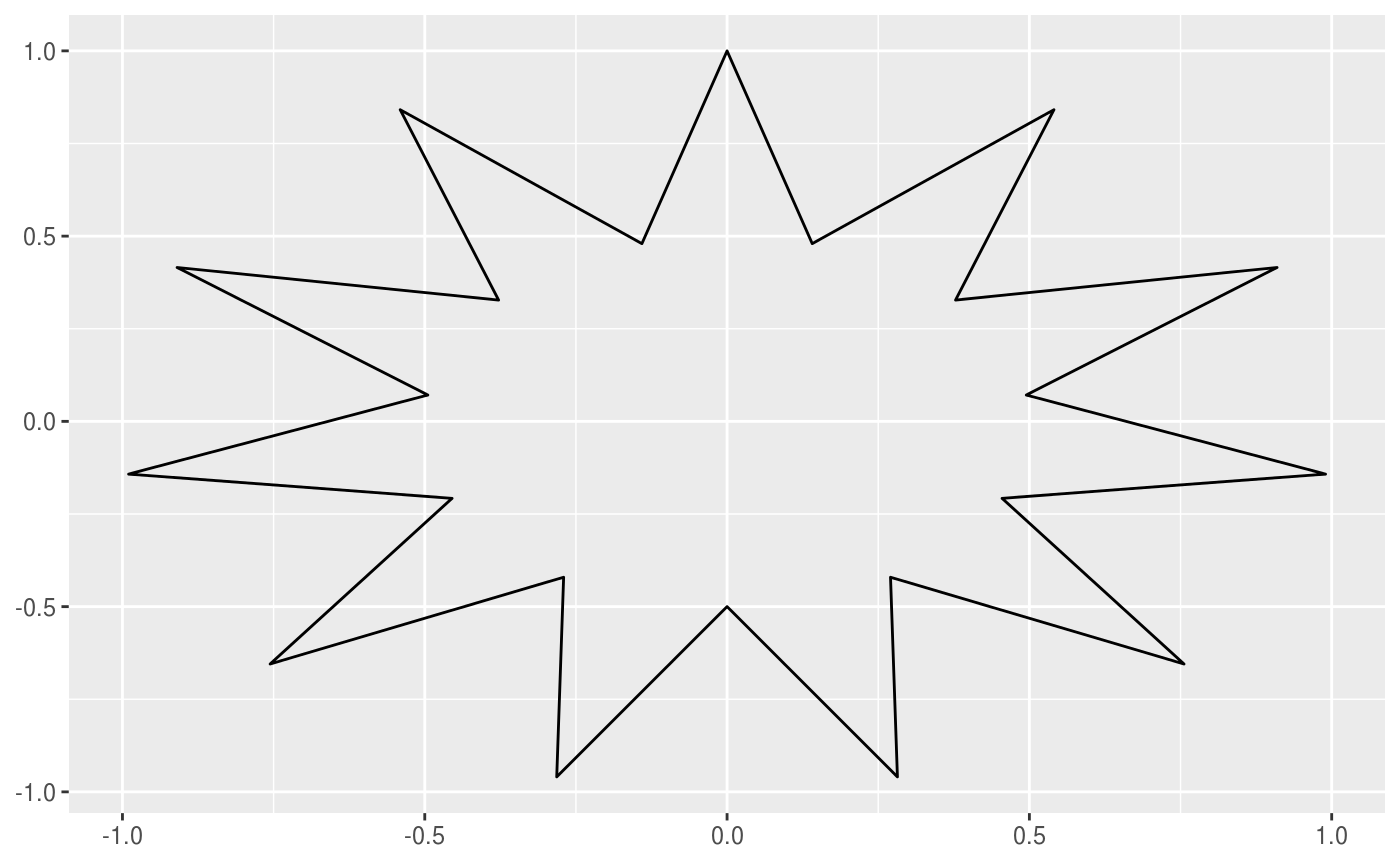
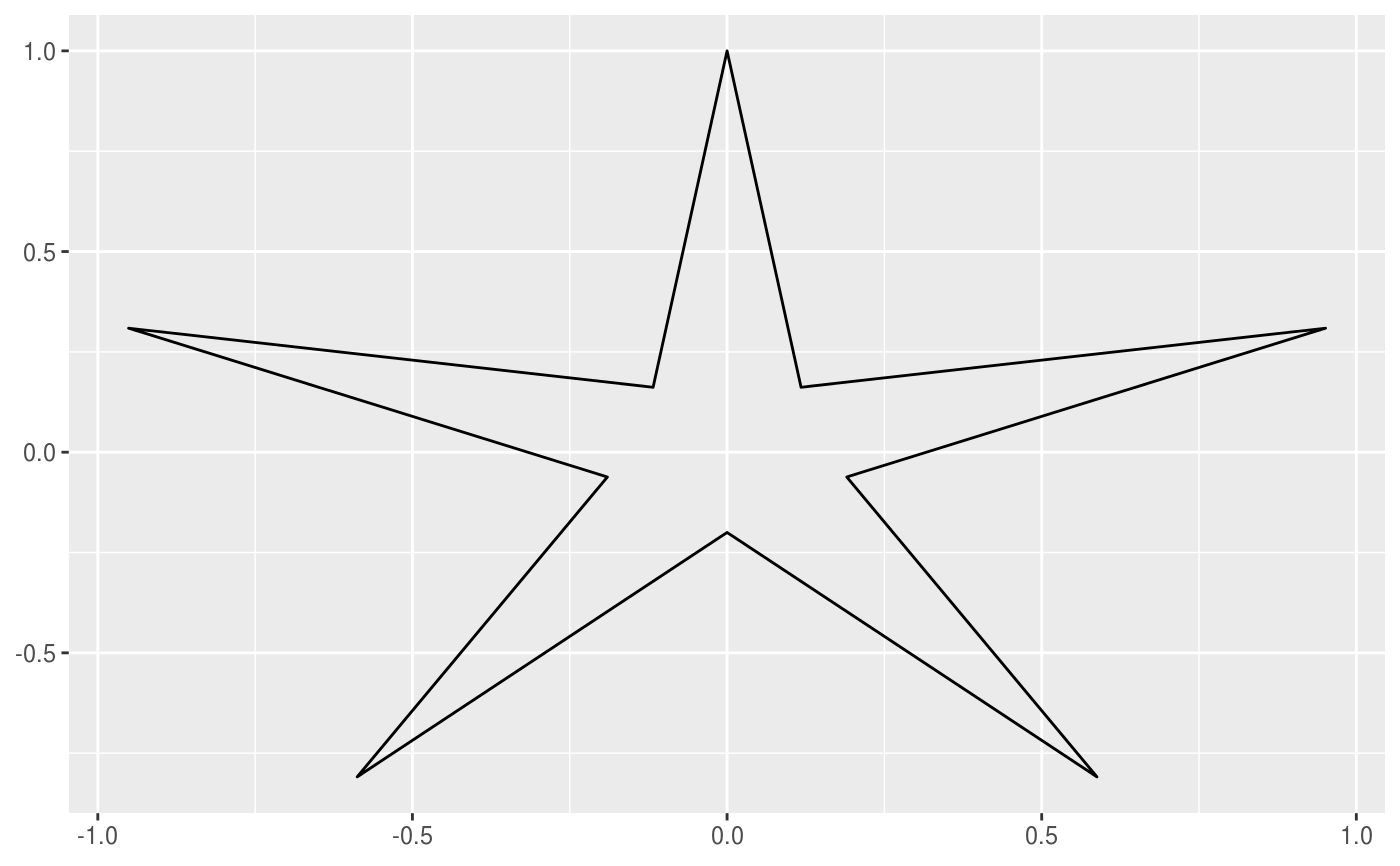
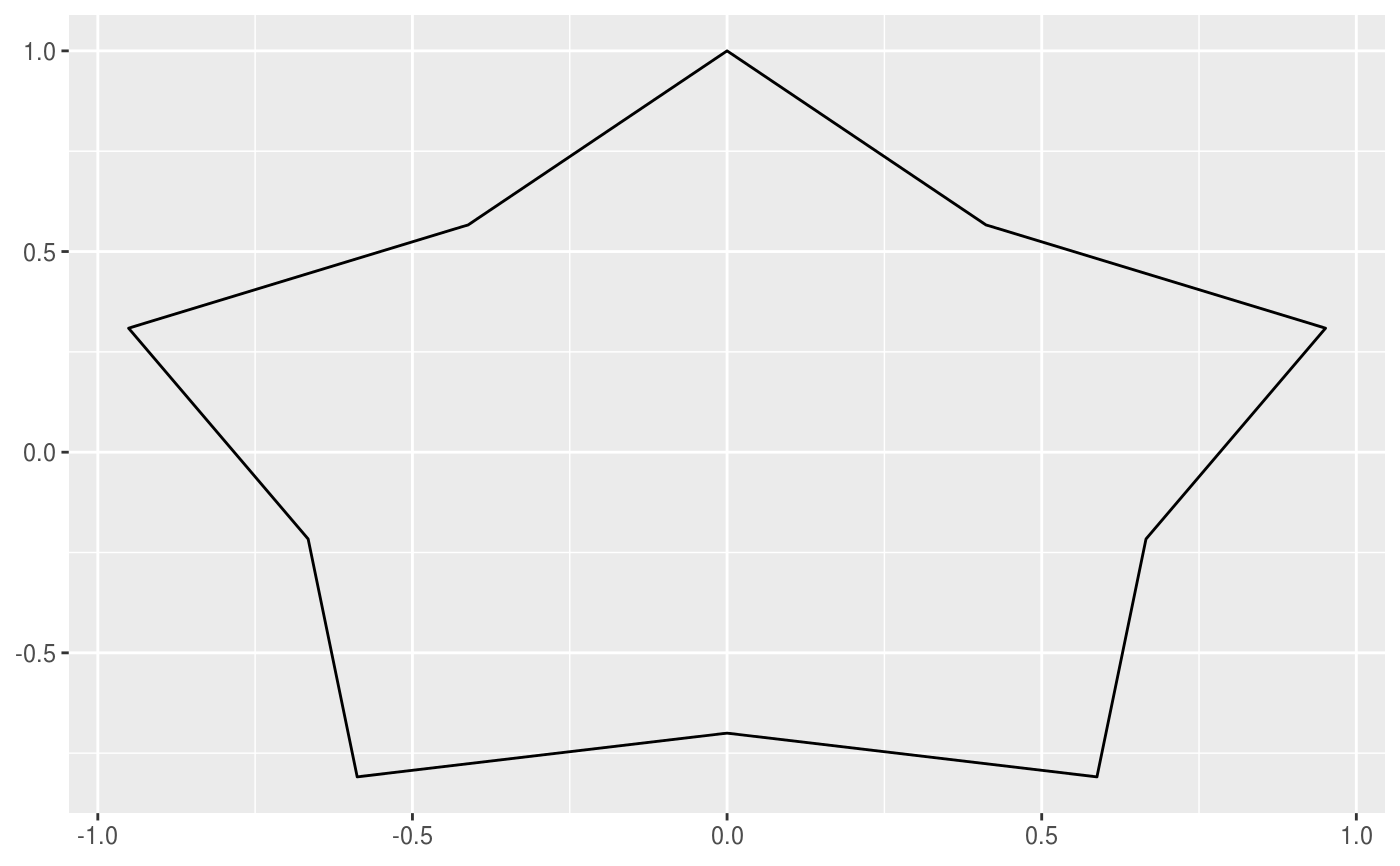
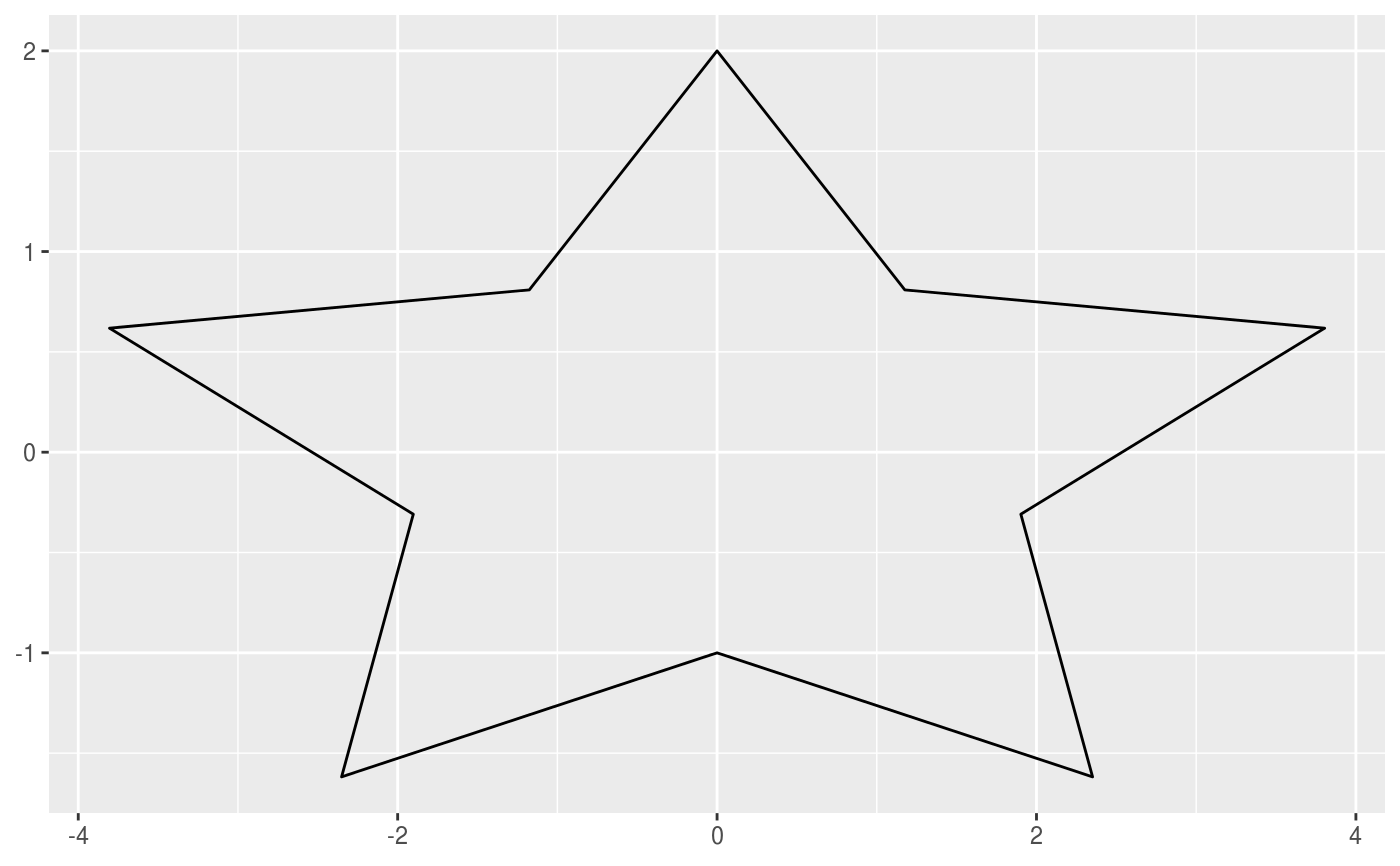
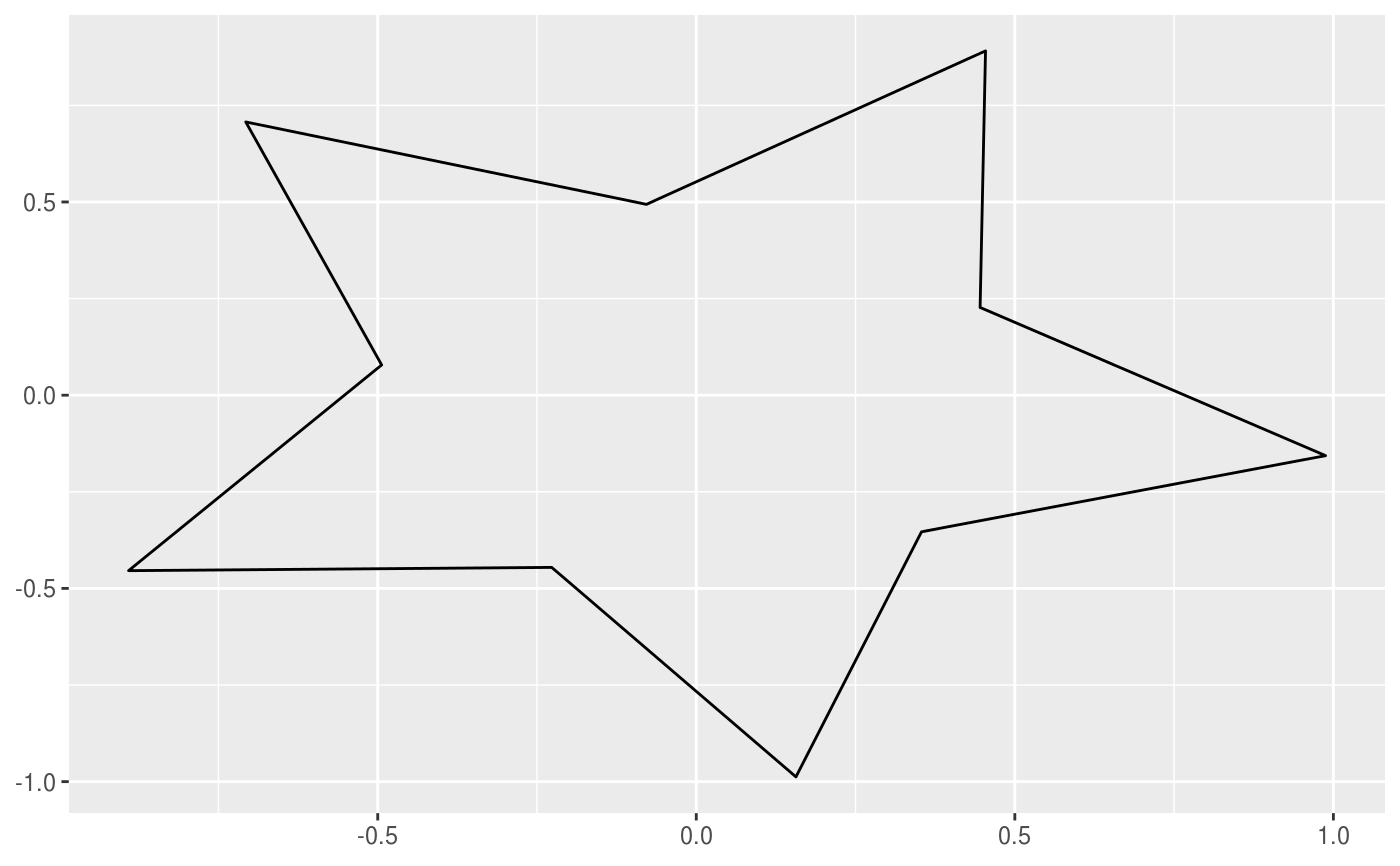
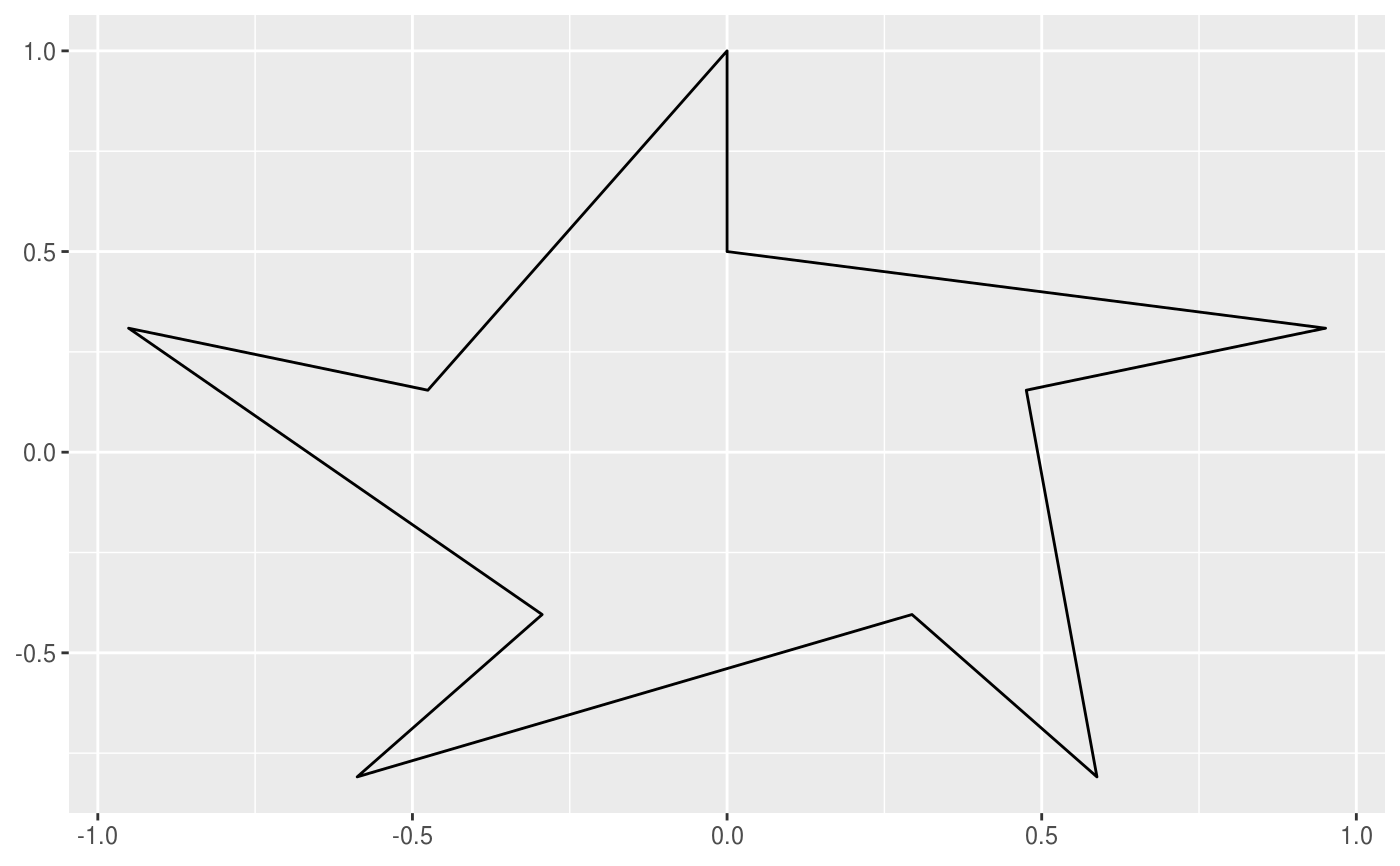
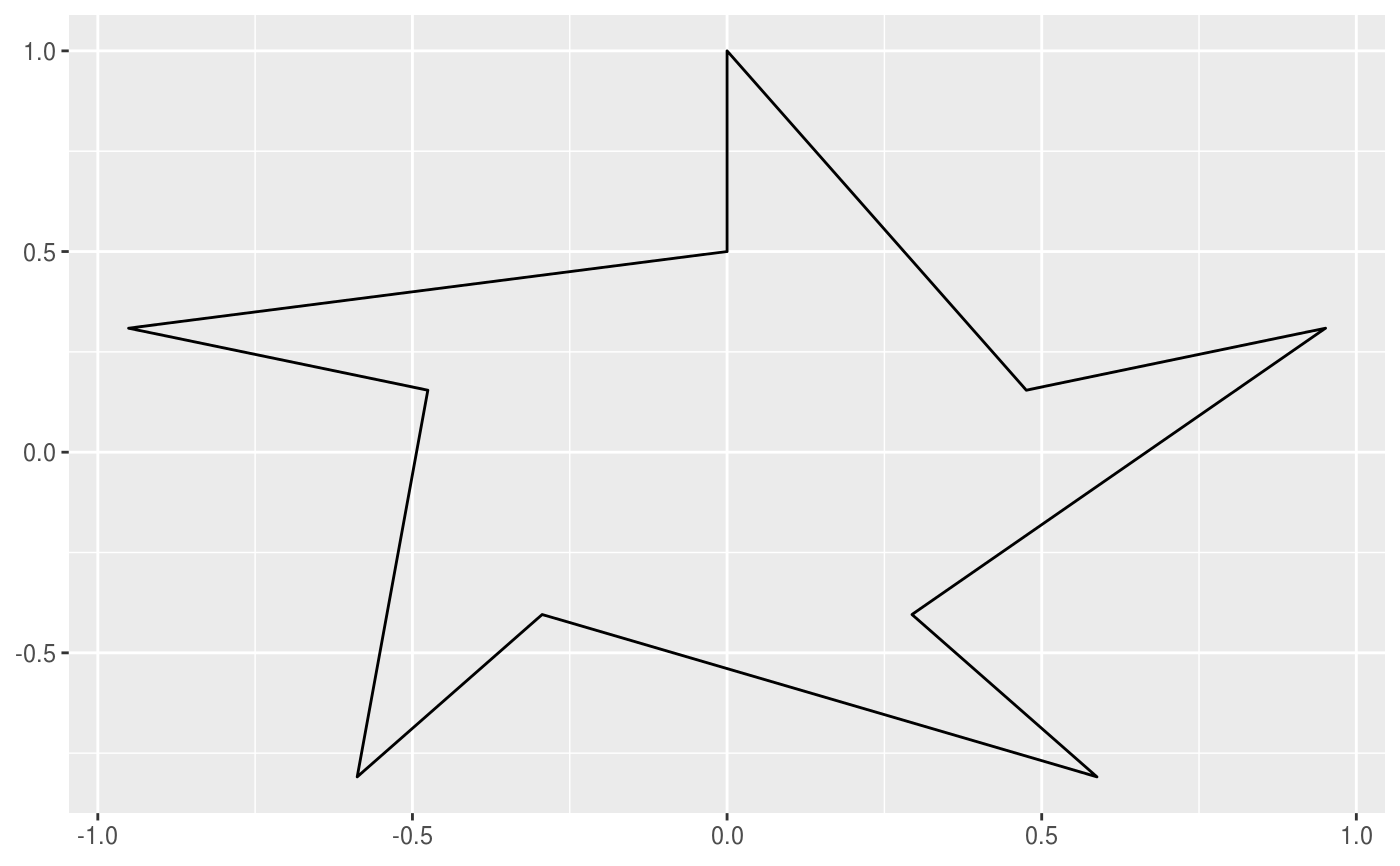
# Changing number of tips ggplot() + geom_star(aes(n_tips = 5))ggplot() + geom_star(aes(n_tips = 11))# changing radei ggplot() + geom_star(aes(r_min = 0.2, r_max = 1, n_tips = 5))ggplot() + geom_star(aes(r_min = 0.7, r_max = 1, n_tips = 5))# rescaling ggplot() + geom_star(aes( n_tips = 5, xscale = 4, yscale = 2))# Rotation ggplot() + geom_star(aes(n_tips = 5, rotation = pi / 4))# Playing witn offset parameter ggplot() + geom_star(aes(n_tips = 5, offset = 0))ggplot() + geom_star(aes(n_tips = 5, offset = 1))ggplot() + geom_star(aes(n_tips = 11, offset = 5))# Regular polygons comes up as a special example when # r_max = r_min / cos(pi / n_tips) ggplot() + geom_star(aes(r_min = 0.5, r_max = 0.5 / cos(pi / 5), n_tips = 5))
