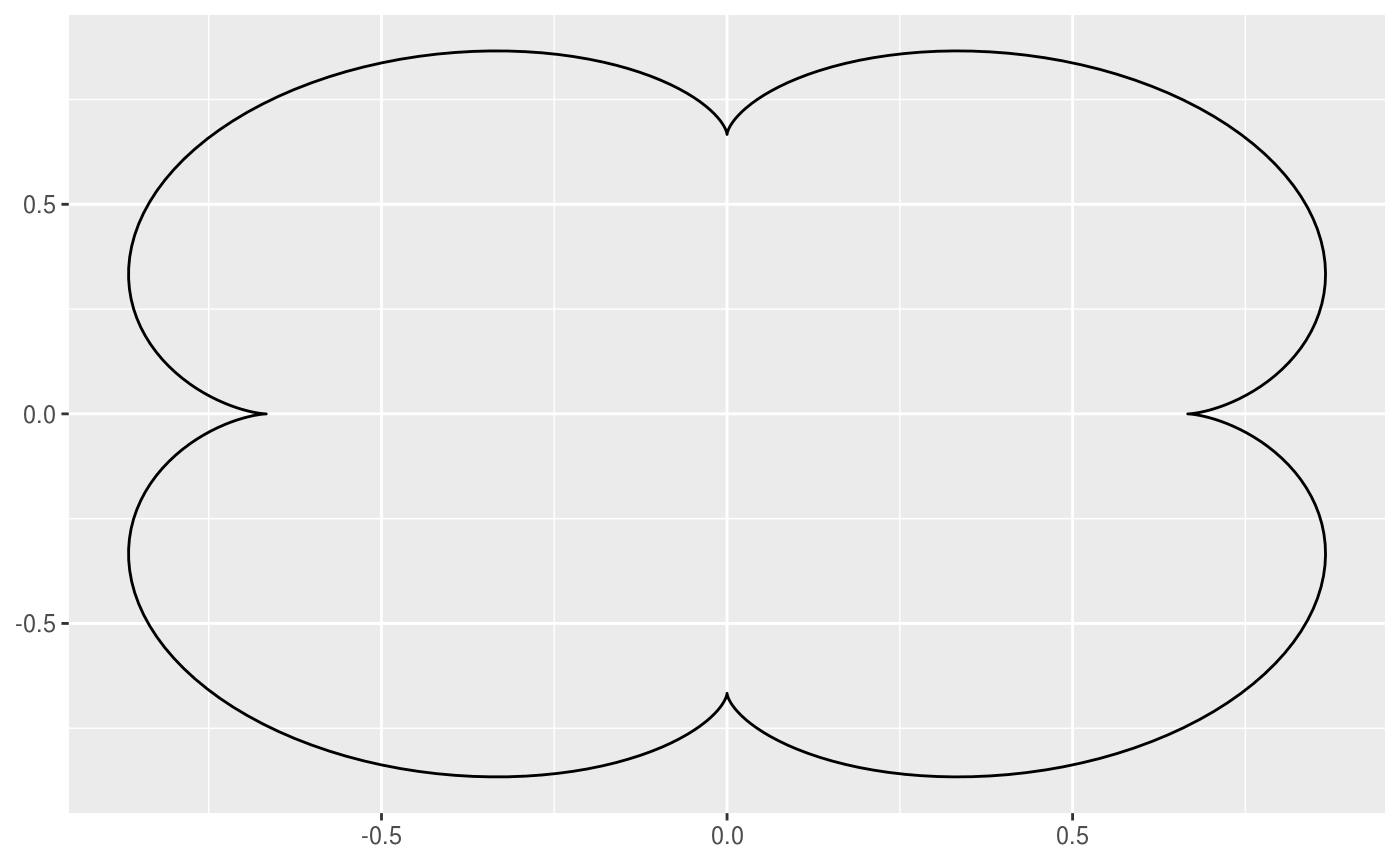
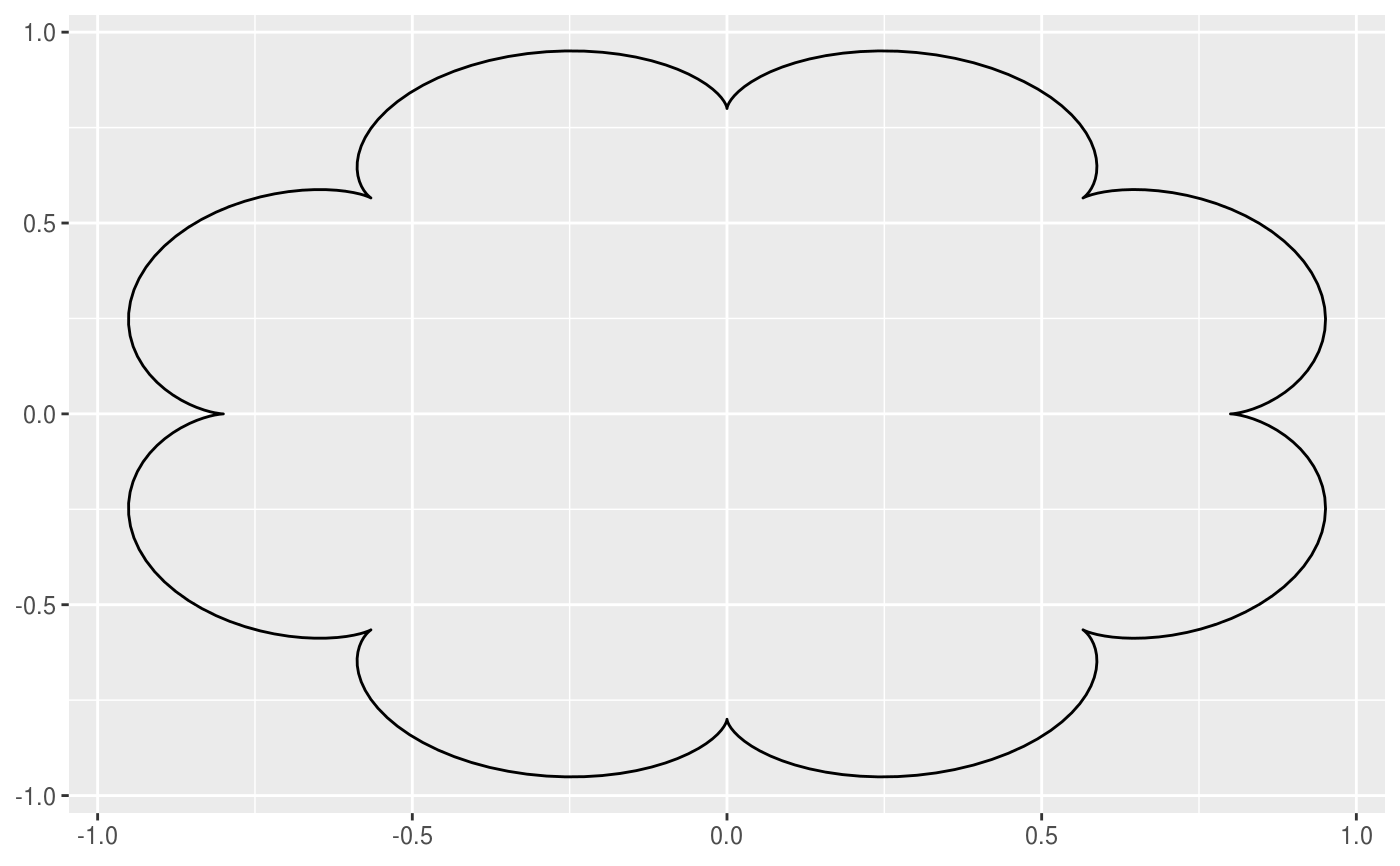
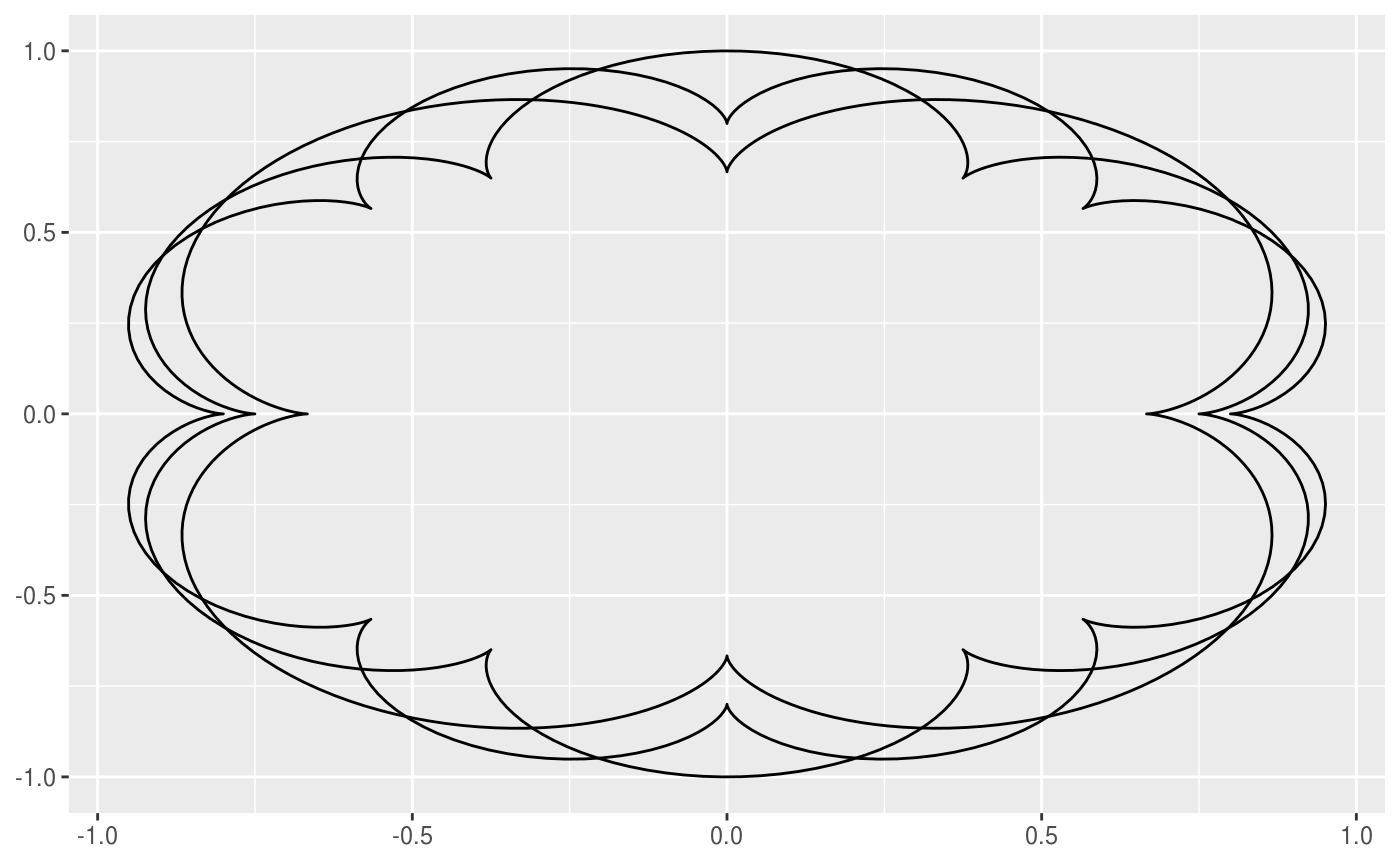
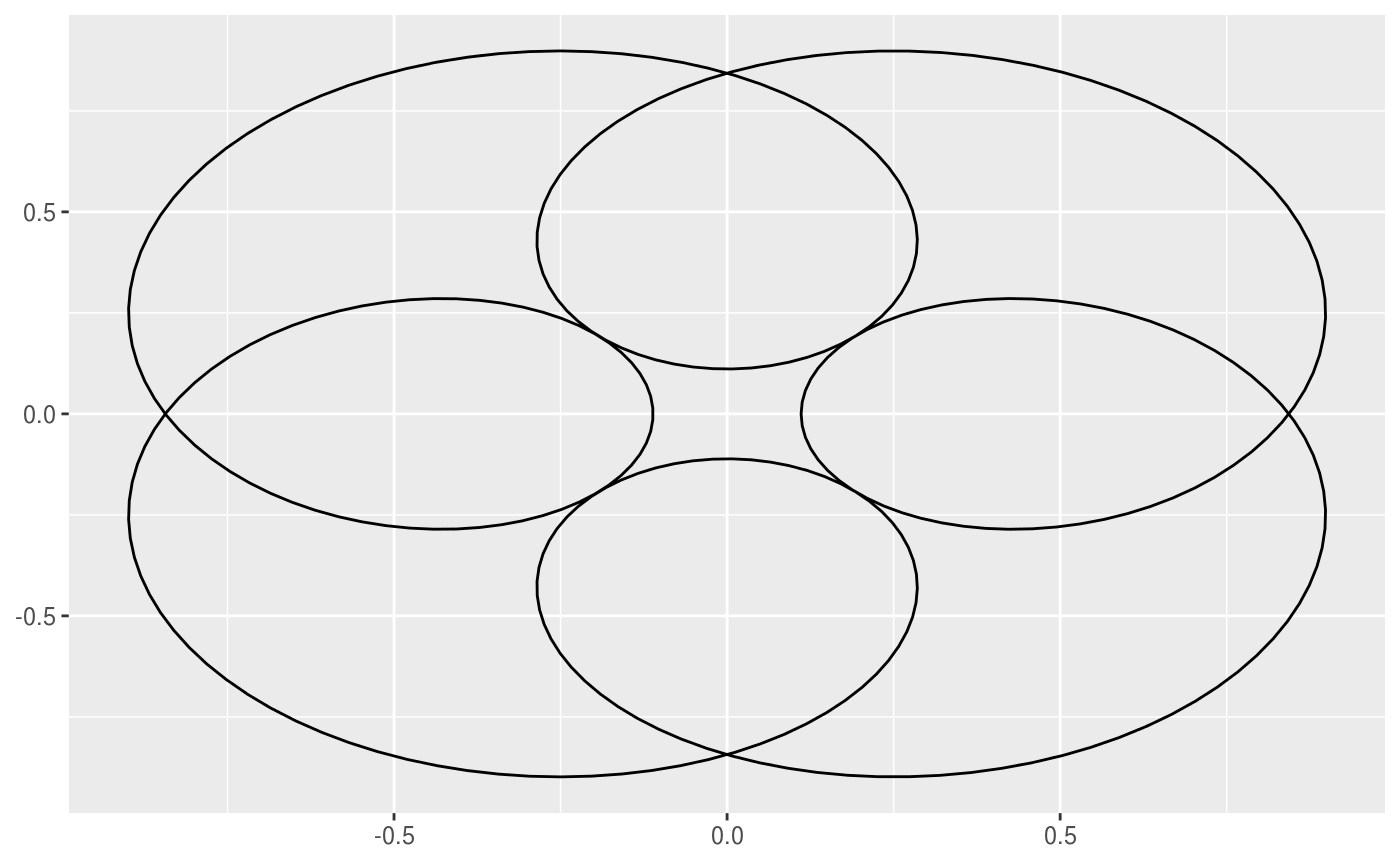
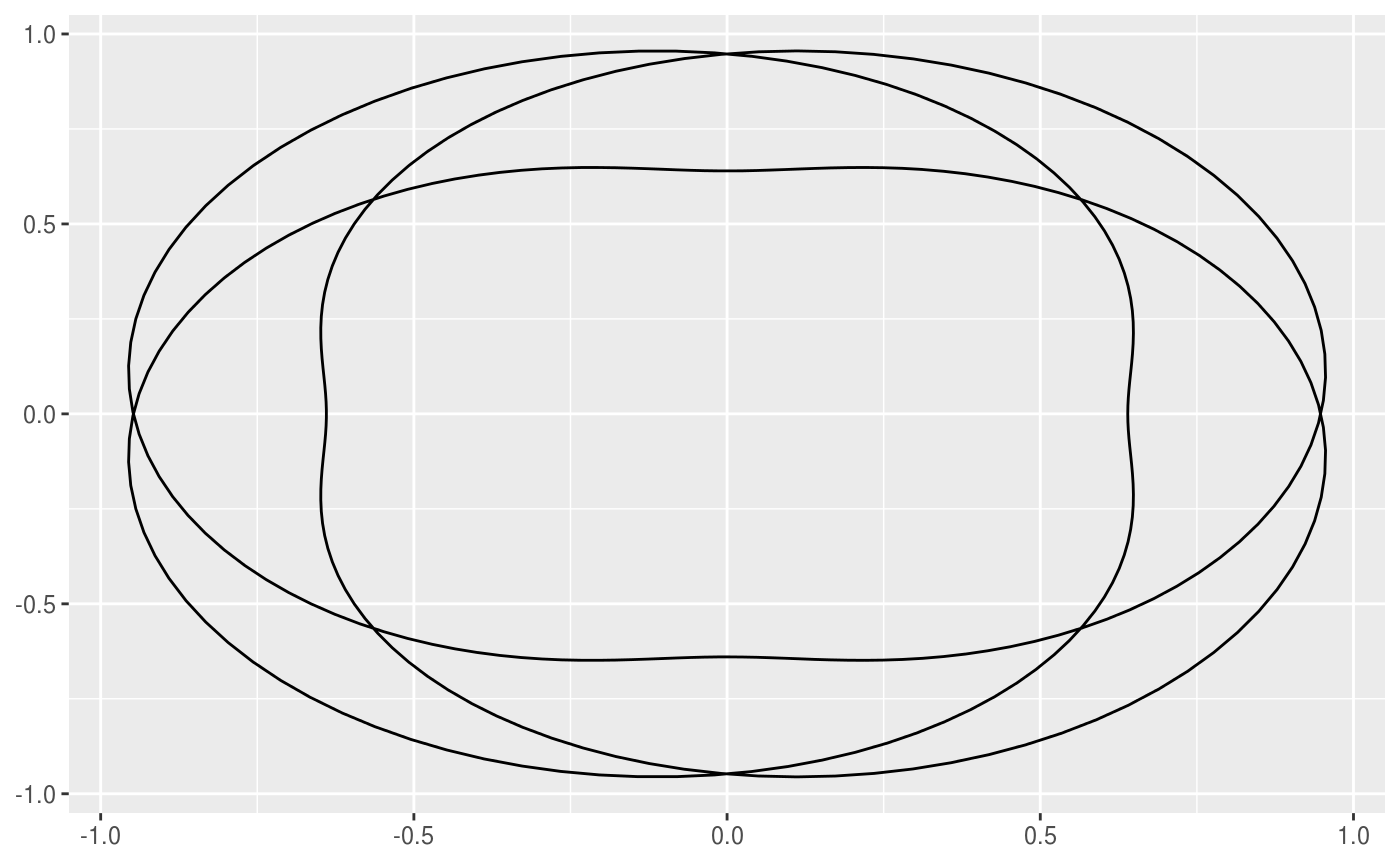
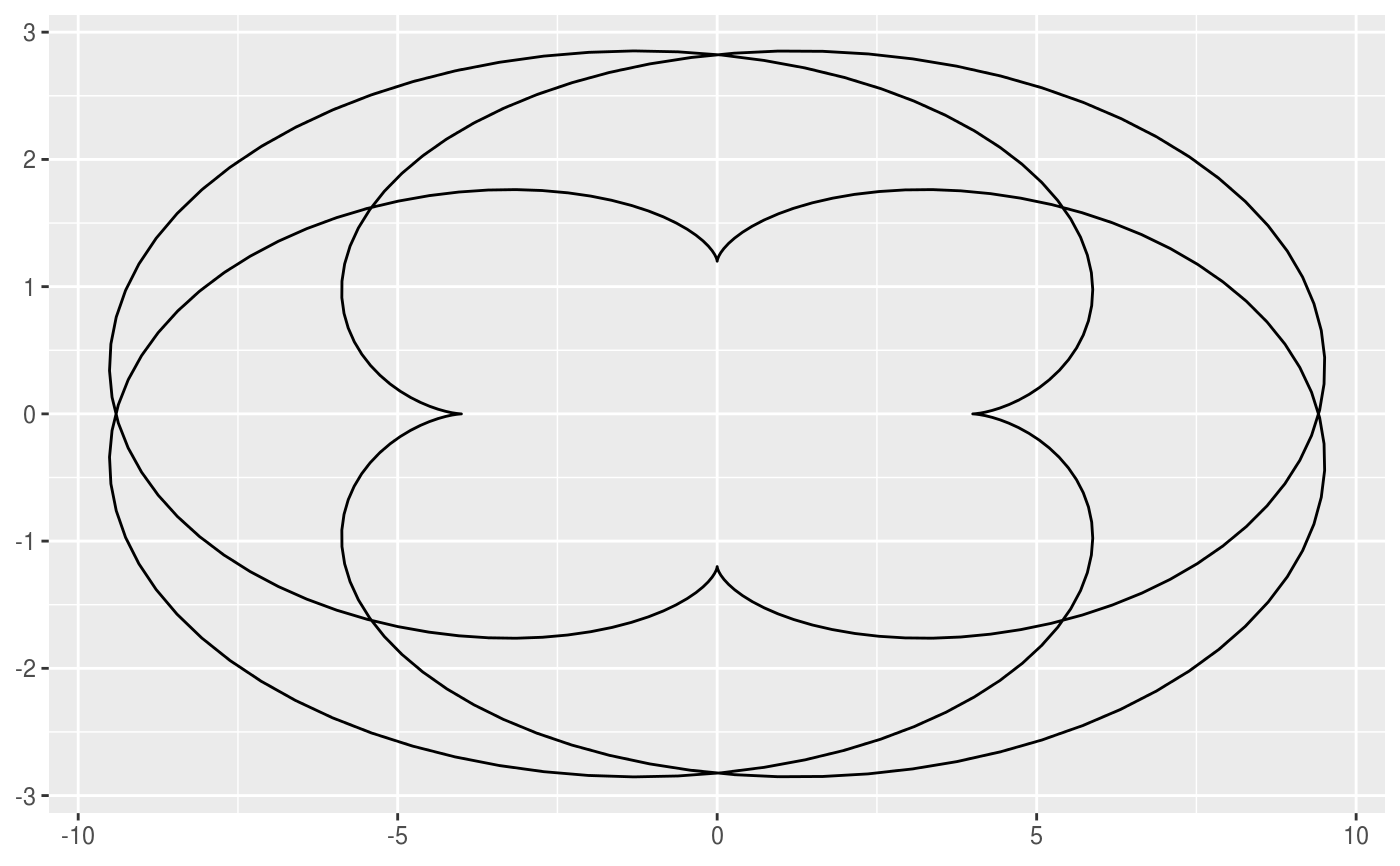
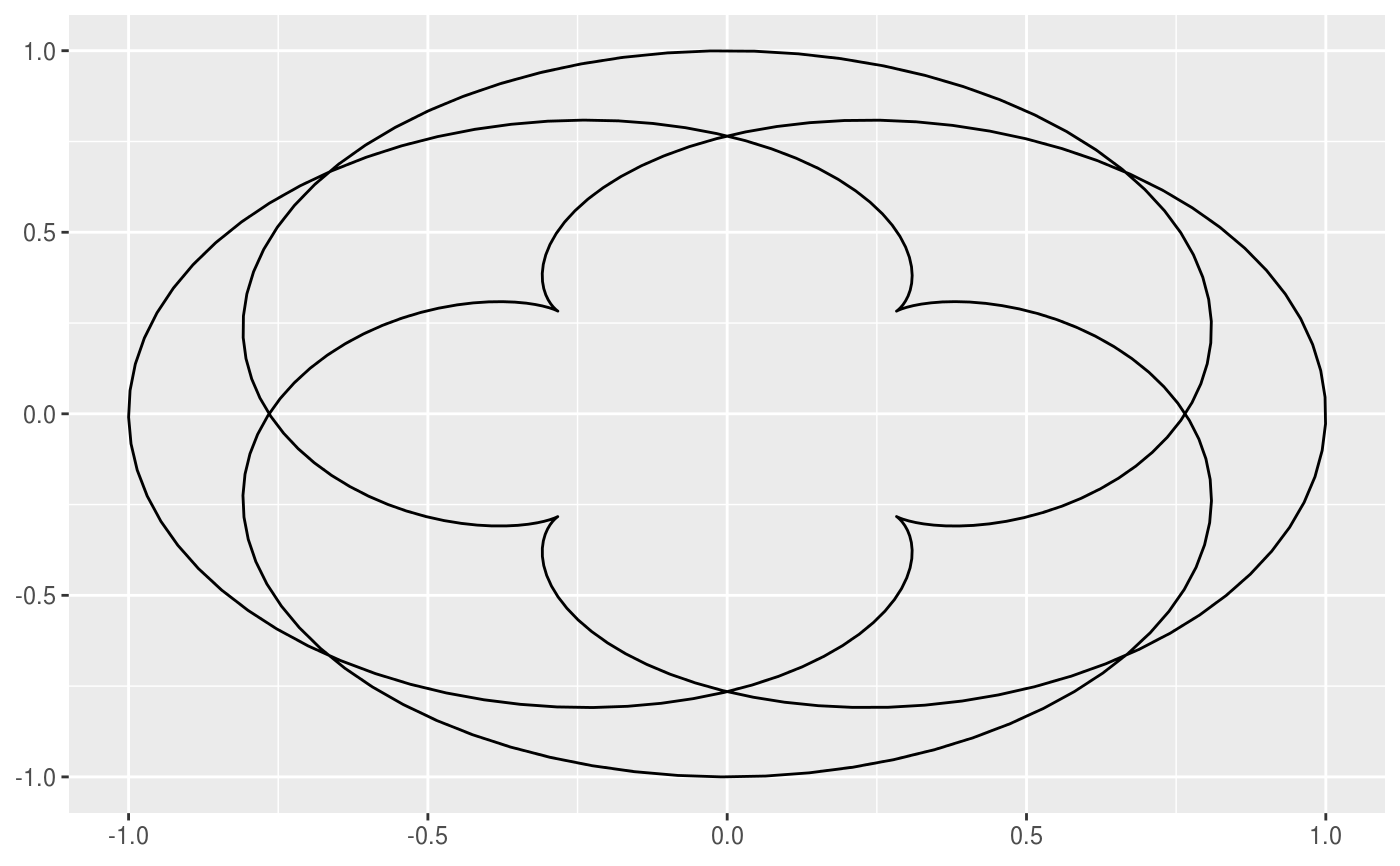
This geom allows you to draw the epitrochoid curve. A epitrochoid is a curve traced by a point attached to a circle of radius r_min rolling around the outside of a fixed circle of radius r_max, where the point is at a distance h from the center of the interior circle. h is the same as r_min by default.
stat_epitrochoid(mapping = NULL, data = NULL, geom = "epitrochoid",
  position = "identity", n_points = 360, na.rm = FALSE,
  show.legend = NA, inherit.aes = TRUE, ...)

geom_epitrochoid(mapping = NULL, data = NULL, stat = "epitrochoid",
  position = "identity", n_points = 360, na.rm = FALSE,
  show.legend = NA, inherit.aes = TRUE, ...)
Arguments
| mapping | Set of aesthetic mappings created by |
|---|---|
| data | The data to be displayed in this layer. There are three options: If A A |
| geom | The geometric object to use display the data |
| position | Position adjustment, either as a string, or the result of a call to a position adjustment function. |
| n_points | The number of points to sample along the curve. |
| na.rm | If |
| show.legend | logical. Should this layer be included in the legends?
|
| inherit.aes | If |
| ... | Other arguments passed on to |
| stat | The statistical transformation to use on the data for this layer, as a string. |
Details
To unscale the curve, please set xscale and yscale to r_max + r_min + h.
The curve follows the the parameterized form
$$x = (r_max + r_min) cos(\theta) - h * cos(\frac{r_max + r_min}{r_min} \theta)$$ $$x = (r_max + r_min) sin(\theta) - h * sin(\frac{r_max + r_min}{r_min} \theta)$$
these curves are closed when the radion \(a / b\) is rational. delta have been scaled to be in the interval [0, 1].
Aesthetics
geom_arc understand the following aesthetics (required aesthetics are in bold):
- **r_max** - **r_min** - h - x0 - y0 - xscale - yscale - rotation - color - fill - size - linetype - alpha - lineend
Computed variables
- x, y
The coordinates for the points along the rose curve
References
http://mathworld.wolfram.com/Epitrochoid.html http://xahlee.info/SpecialPlaneCurves_dir/Epitrochoid_dir/epitrochoid.html
See also
[geom_hypotrochoid()]
Examples
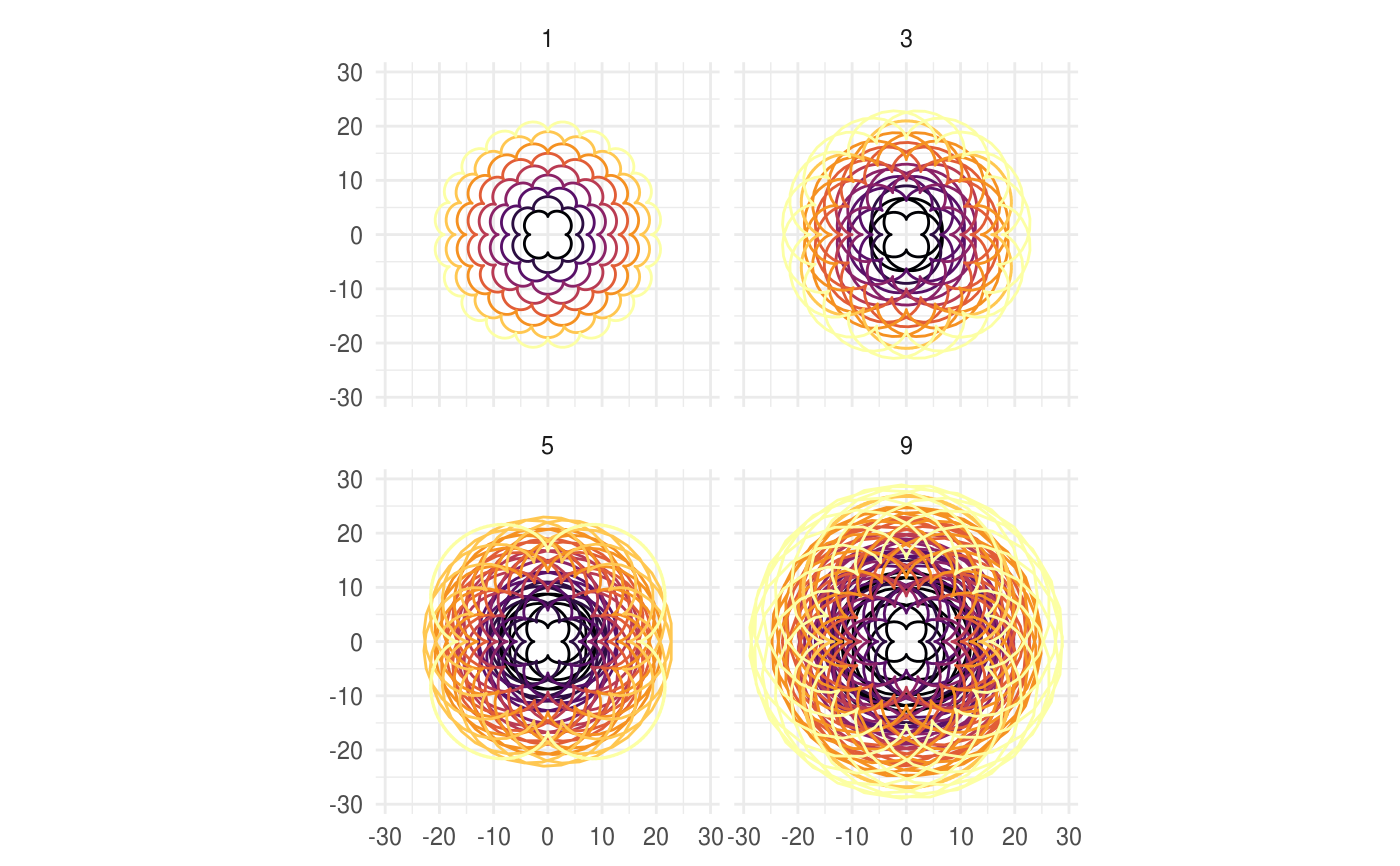
# When h is missing a hypocycloid is generated ggplot() + geom_epitrochoid(aes(r_max = 4, r_min = 1))ggplot() + geom_epitrochoid(aes(r_max = 8, r_min = 1))# specifying h ggplot() + geom_epitrochoid(aes(r_max = 4, r_min = 1, h = 4))ggplot() + geom_epitrochoid(aes(r_max = 4, r_min = 3, h = 20 / 13))# Changing the horizontal and vertical scale ggplot() + geom_epitrochoid(aes(r_max = 4, r_min = 3, xscale = 10, yscale = 3))# Rotating shape ggplot() + geom_epitrochoid(aes(r_max = 4, r_min = 3, rotation = pi / 4))# When things go wild ggplot(expand.grid(seq(4, 20, by = 2), c(1, 3, 5, 9))) + geom_epitrochoid(aes(r_max = Var1, r_min = Var2, color = Var1, xscale = Var1 + Var2, yscale = Var1 + Var2)) + coord_fixed() + theme_minimal() + scale_color_viridis_c(option = "B") + guides(color = "none") + facet_wrap(~ Var2)
